Import demand analysis for wheat in Mongolia
Abstract
Wheat is one of the strategic product in Mongolia (Food Supply Law, 1995). Thus, Mongolian government implemented many projects to protect the strategic product’s domestic market. One of the important program is “Atar” 3rd Agricultural land Rehabilitation program. The purpose of this program is to intensify development of the arable land of Mongolia, by creating legally and economically favorable conditions for engaging in farming and steadily supplying the population with safe products (thus eliminating dependence on imports) (Third Atar campaign, 2009). But we have still import for crop production. For instance, wheat, flour, potato, vegetables and fruit. For that reason, this paper analysed the factors affecting aggregate function of import demand for wheat in Mongolia during the period 1997-2017 by using double log-linear regression model. Mongolia’s import demand for wheat was determined as a function of gross domestic product per capita, domestic production, real import price, exchange rate MNT-US dollar and trend. The result have been estimated that a change of exchange rate is strongly affective on th wheat import demand.
Key words: Wheat, import demand, double log-linear regression model
Introduction
Wheat is the one of the main producing crop in Mongolia. In 2017, total sown area in Mongolia was 524.3 thousand ha, which of approximately 75 percent was wheat production, for the 25 percent in potato, vegetables and other crop production (NSO, 2017). Total production of wheat is 231.4 thousand tons, which is twofold decrease from 467.1 thousand tons in the same period last year and 42 percent lower than the five-year average.
Also, the national average yield for 2017 is estimated at 0.6 tonnes/hectare, compared with 2016 and average level of 1.34 tonnes/hectare. The reason of lower yield was drought climate condition. The extended period of severe dry weather last year, which was intensified by unusually high temperatures, severely affected the wheat crop at the critical growing stages of heading and flowering (FAO, 2017). The wheat import was 13.6 thousand tons in 2017 and 10 times lower than compared with 2016. Crop production has been increasing since 2008 when the Third Land Rehabilitation Campaign started. Even domestic production of wheat is increasing, amount of imported wheat in Mongolia is still significant.
Import demand analysis estimates are important inputs into most trade policy simulation models. Import demand functions in aggregate level have traditionally included a relative price variable, real income, and dummy variables to account for unusual periods such as devaluations or policy changes. The relative price measure is often the ratio of the import price to the domestic price index for the commodity adjusted for the exchange rate, which gives a measure of the real exchange rate (T.A. Boylan, M.P. Cuddy and I. O’Muircheartaigh , 1980; Tanyeri-Abur and Parr Rosson, 1998; M. Uzunoz and Y. Akcay, 2009).
The goal of this paper is to determine import demand factors for wheat in Mongolia during the period 1997-2017 by using secondary data. We can not use other theoretical demand systems, such as the Armignton model, AIDS and Rotterdam models, for demand analysis of wheat. But, we can not used these model because data is not enough and uncertainty. So, we estimated using to analyse aggregate import demand function. The paper is presented in three parts. The first part introduces the Mongolia’s wheat market. The methodology and data sources are in second part. The last part presents the empirical result and conclusion.
Mongolia’s wheat market
The total sown area in Mongolia is 524.3 thousand ha that is decreased by 33.4 percentage ha in the 1990 year (Fig 1). The grain area share approximately 75 percent was wheat production, for the 25 percent in potato, vegetables and other crop production (NSO, 2017). Until the middle of the 1990s Mongolia was self-sufficient in wheat and an occasional exporter. At the peak of agricultural production in 1989, approximately 1.38 million hectares of land was classified as arable or planted in permanent crops, and about 700,000 ha (50%) of this was actively harvested (FAO 2008). During this period, crop production also became a larger proportion of total agricultural production. Unfortunately, the country has moved to free-market economy in 1990.
Figure 1. Total sown area and grain area, thous.ha, 1990-2017
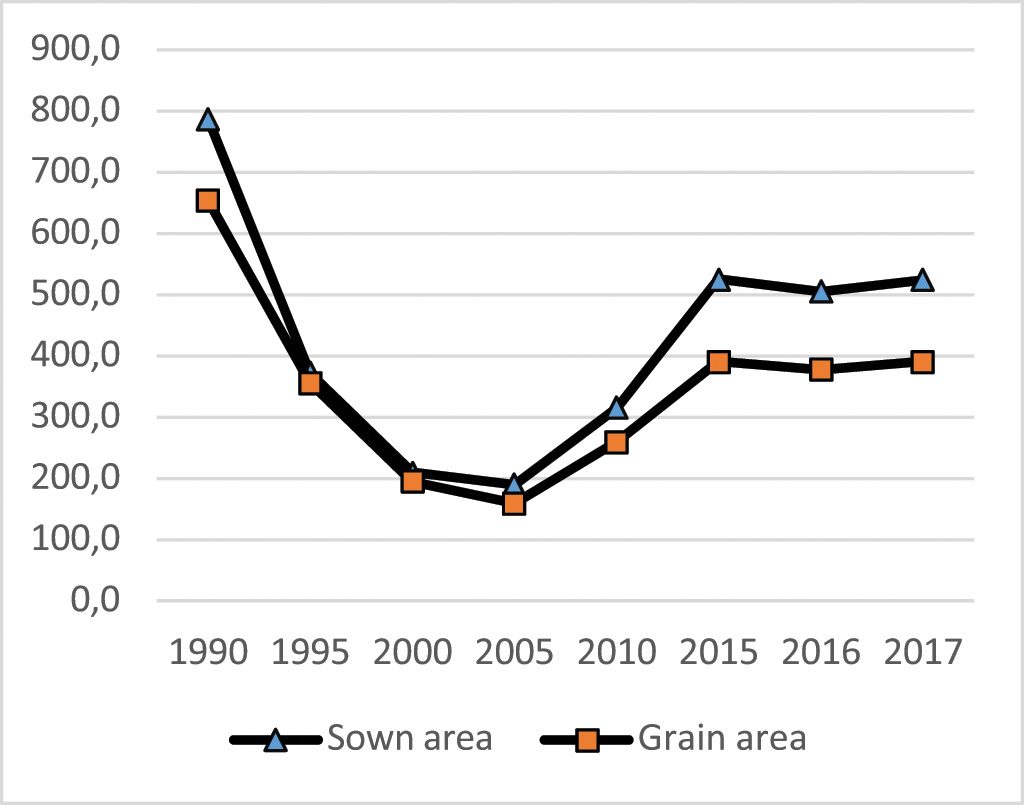
Since the political and economic transition has been characterized by a 70% crash in total crop production across Mongolia, and similar declines in land in production and yield. The contribution of crops to the agricultural sector of the Mongolian economy dropped from 23% in 1989 to 10% in 1992. The amount of land actually harvested and total production has crashed until 2005. Since 2005, the amount of sown area has been increasing to about 525.0 thousand hectare in 2017. Total production of wheat is 231.4 thousand tons and the yield is 0.6 tn/ha (Fig 2) in 2017. Wheat production is twofold decrease from 467.1 thousand tons in the same period last year.
Total production of wheat is 231.4 thousand tons and the yield is 0.6 tn/ha (Fig 2) in 2017. Wheat production is twofold decrease from 467.1 thousand tons in the same period last year.
Source: Mongolian Statistical yearbook, 2017
Prior to the political and economic transition system, crop production was generally met by domestic production. The collapse of production since 1990 has been accompanied by dramatic decreases in both the amount of land harvested and efficiency (Fig 2). National average wheat yeald was 0.6 tonnes/hectare in 2017, which was declined compared with 2016 average level of 1.34 tonnes/hectare.
Figure 2. Total wheat production and average yield per hectare, 1990-2017
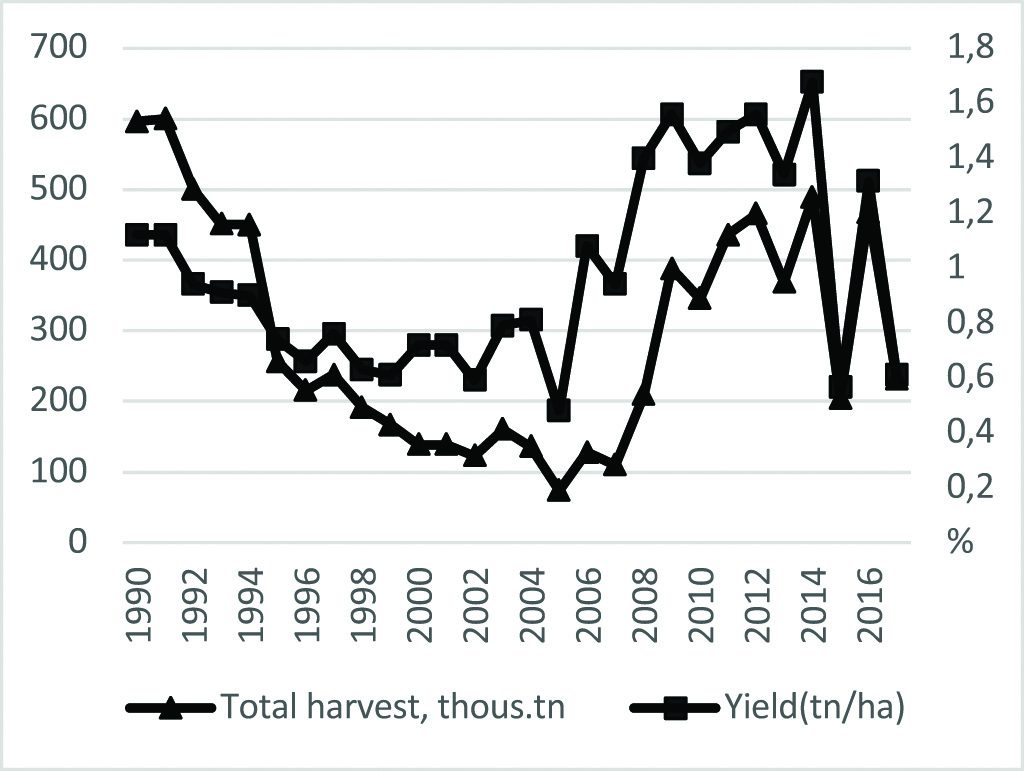
The average yield decline resulting from privatization of crop production and drought to related impact of dzud and attributed to the longer -term impact of transition and structural reform in 1990s. Wheat yields in Mongolia fluctuated about an average from 0.5 to 1.2 tn/per hectare. Especially after 2005, it has increased, highest yield was 1.6 tn/per hectare in 2014.
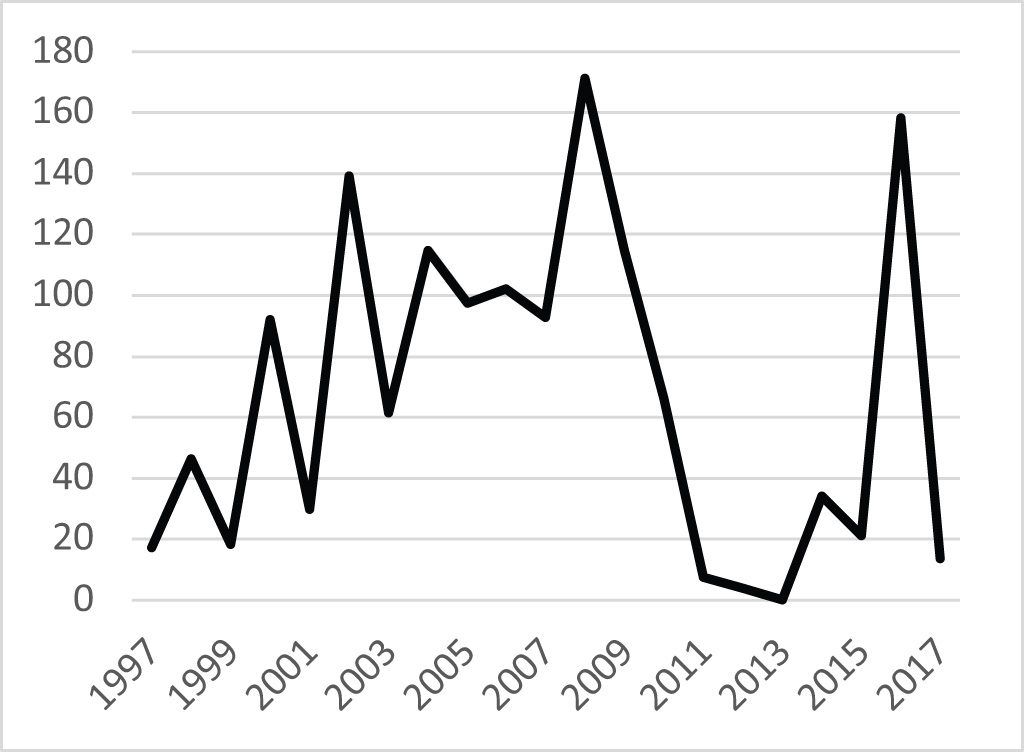
Since 1997, Mongolia have been started import for wheat associated with that crop production dropped in earlier of transition system. For example, in 2002, total domestic production met only 32.7%, and vegetable production only 30%, of local demand. At a peak of wheat import was 171.3 thous.tonnes in 2010 (Fig 3). Since 2010, wheat import had been declining until 2016. These trends and reliance on imports is considered a risk in terms of Mongolian food security. In earlier 2008, the Mongolian government announced the start of the Third Atar Campaign, to be implemented, at least preliminarily, from 2008-2010. Most of the imported wheat is Russian Federation and Kazakhstan.
Figure 3. Wheat import, between 1997-2017, by thous.tonnes
Methodology and data source
Most of the studies on import demand analysis is based on the derived demand for import. For example, Weining Mao, Won W. Koo, Jon P. Suomala and Takeshi Sakurai try to defined using the translog cost function is used to analyze import demand for wheat differentiated by class and country of origin in the Japanese wheat flour milling industry. Also, Jung-Hee Lee, Won W. Koo, and Mark A. Krause was used AIDS model to determine elasticities for Japanese wheat import demands. These studies are based on expenditure function related with wheat production cost and expenditure share of imports.
However, some studies of import demand analysis are based on traditional import demand function especially at aggregate level. These studies represented by Boylan, M.P. Cuddy and I. O’Muircheartaigh (1980) and Tanyeri-Abur and Parr Rosson (1998). For instance, Boylan, M.P. Cuddy and I. O’Muircheartaigh estimated using traditional import demand function real gross domestic product and ratio of the import price for case of three European economies. Tanyeri-Abur and Parr Rosson (1998) analysed import demand analysis for dairy products in Mexico. They used to estimate import demand function real income, real exchange rate, lagged imports of products and time trend.
Aggregate import demand model
Import demand functions have traditionally included a relative price, real income, and dummy variables to account for unusual periods such as devaluations or policy changes (Tanyeri-Abur and Parr Rosson, 1998). However, the simplest import demand function (T.A. Boylan, M.P. Cuddy and I. O’Muircheartaigh , 1980) is expressed as:
Mt = f (Yt’ P*) (1)
Where, Mt – is the quantity of import demand in t time,
Yt– is the real GDP per capita in t time and P*– is the relative price -ratio of the price of import to domestic price level.
Mongolia’s import demand for wheat was determined as a function of gross domestic product per capita, Mongolia MNT-US dollar exchange rate, domestic production of wheat and real price of import wheat. The model is expressed in general form as:
Mtd = f (Yt’ EXRt’ DPt’ Ptm,T) (2)
Table 1. ADF test result
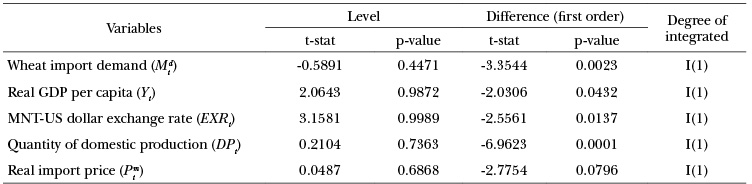
Source: Result of E-views 10.0
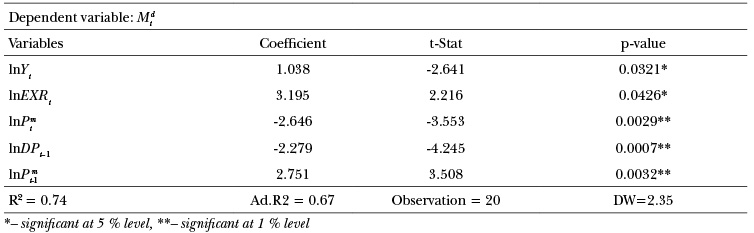
Table 2. Estimation result for wheat import demand, 1997-2017
The general log-linear formulation form of the aggregate import demand equation is:
lnMtd = α0+α1lnYt+α2lnEXRt+α3lnDPt+α4lnPtm+α5T+st (3)
Where,
Mtd – is the quantity of wheat import demand in t time, thous.tonnes
Yt – is the real GDP per capita in t time, thous.MNT
EXRt – MNT-US dollar exchange rate in t time
DPt – quantity of wheat domestic production in t time, thous.tonnes
Ptm – real import price in t time, thous.MNT
T – time trend
εt,– is assumed to be an error term
α0, α1, α2, α3, α4, α5 – are estimated coefficient
Data
In this study, annual data for the period from 1997 to 2017 were used in this study. Mongolia’s wheat import started from 1997. The all data has been collected from the Mongolian Statistical Yearbook and Mongolian Customs Yearbook. Mtd and DPt are quantity of wheat import and doemstic production of wheat in year t, Yt is real gross domestic product (GDP) per capita in year t, GDP per capita at constant 2015 prices. Ptm is price variable real import price based also constant 2015 prices in year t.
Estimation results
We estimated equation (3) for the wheat using ordinary least squares. In many economic time series data are probably non-stationary. Non-stationary variables imply the risk of spurious regression unless they are co-integrated. An Augmented Dickey-Fuller (ADF) test for identifying the order of integration for the price and quantity ratio is conducted to determine the order of integration. Each variable is integrated at the first order I(1) (ADF test results shown in table 1). Thus, to avoid the risk of spurious regressions these series are dropped from continuing analysis.
Results of the estimation for wheat import demand are given in Table 2. As per Table 2, the equation was Ad.Rsquare(0.67). It is mean that our independent variables able to explain 67 percent of dependent variable of wheat import demand. The statistically significant variables are GDP per capita, exchange rate of MNT-US dollar(significant at 5 %), and real import price (significant at 1 %). The domestic production variable and constant α0 are non statistically significant.
But lagged domestic production variable is statistically significant(significant lelvel at 1 %). Time trend variable was non statistically significant. Also, the Durbin -Watson statistic test was used to check if there was autocorrelation in our estimation. The Durbin– Watson test was calculated (2.35) because of the inclusion of the lagged domestic production and real import price. If there is no-serial correlation, d(Durbin-Watson test coefficient) is expected to be about 2 (Gujarati, 1995). Our estimated Durbin-Watson was 2.35 which mean that our estimation has not autocorrelation.
One of the important affecting factor to the import demand for wheat is GDP per capita. When GNP per capita increases, consumption will increase and vice versa. Income elasticity for wheat was (1.038). This indicates the value for the amount of imported wheat will increase more as incomes increase. Another main factor is real import price. The import price coefficient is (-2.646), which indicates that an increase in real import prices of wheat by one unit would be associated with an decrease of the value for the amount of imported wheat by 2.646 units. Most strongly affecting factor is exchange rate MNT-Us dollar for wheat import demand. Real exchange rate was positive (3.195). The sign indicates that import value of wheat increase with the increase of MNT/USD parities.
The lagged domestic production coefficient is negative (-2.279). In other word, a 1 percent lagged domestic production increase would cause wheat import demand to decreases by 2.3 percent. Therefore, the lagged real import price was statiscally significant but sign is positive.
Conclusion
This paper is providing estimates the factors affecting import demand for wheat by using aggregate import demand function during the period 1997-2017 in Mongolia. Mongolian government implemented many projects to protect the strategic product’s domestic market. One of the important program was “Atar” 3rd Agricultural land Rehabilitation program. Crop production has been increasing since the Third Land Rehabilitation Campaign started. But, even domestic production of wheat is increasing, amount of imported wheat in Mongolia is still significant.
According to the results, the GDP per capita and exchange rate of MNT-US dollars was found significant level of 5 %. The real import price, lagged domestic production and lagged import price was found significant level at 1 %. The results of estimation indicate that there were very strong relationship between quantity of import demand and our independent variables. Mostly strong affecting variable was exchange rate.
In the future, this paper will be able to improve adding some variables for instance domestic real price and value of domestic production. Also, we will be using to improve another import demand model AIDS, Rotterdam model.
References
Amar Uuld and Robert Magda, 2018. Estimating Armington elasticities for wheat in Mongolia. Sustainable development of Agriculture and economy, Issue ISSN 2519-2000, pp. 92-95.
FAO, 2014. Statistical yearbook. Rome: Food and Agriculture Organization of the United Nations.
FAO, 2017. Crop and Livestock Assessment Mission report, Ulaanbaatar: s.n.
Food Supply Law, 1995. Food Supply Law. Ulaanbaatar: s.n.
Greene, W. H., 2000. Econometric Analysis. Fourth Edition. USA: Prentice Hall Int.Inc.,.
Gujarati, D. N., 1995. Basic Econometrics. 3th Edition. International Edition ed. USA: McGraw-Hill, Inc..
Jung-Hee Lee, Won W. Koo, and Mark A. Krause, 1994. Japanese wheat import demand. Agricultural Economics Report, Volume No.317.
L. J. S. Baiyegunhi and A. M Sikhosana, 2012. An estimation of import demand function for wheat in South Africa: 1971-2007. African Journal of Agricultural Research , Vol. 7(37)(ISSN 1991-637X © 2012 Academic Journals ), pp. pp. 5175-5180.
M. Uzunoz and Y. Akcay, 2009. Factors affecting the import demand of wheat in Turkey. Bulgarian Journal of Agricultural Science, Issue 15:60-66, pp. 60-66.
Neil R.Chalmers, 1993. Policy alternatives for livestock development in Mongolia (PALD) , Ulaanbaatar: Institute of Agricultural econoomics.
NSO, 2017. Mongolian statistical yearbook. Ulaanbaatar: s.n.
Song, W., 2005. Import demand elasticities for Agricultural products in Korea, Seoul: National Assembly Budget Office .
T.A. Boylan, M.P. Cuddy and I. O’Muircheartaigh , 1980. The functional form of the aggregate import demand equation:
A comparison of threa European economies. Journal of International Economics , Issue 10 (1980) , pp. 561-566.
Tanyeri-Abur and Parr Rosson, 1998. The NAFTA and Mexican import demand for dairy product. San Antonia, USA, Department of Agricultural Economics, Texas AM University.
Third Atar campaign, 2009. The national program on developing arable land: “The 3rd Atar campaign”, Ulaanbaatar: Ministry of Food and Agriculture.
Weining Mao, Won W. Koo, Jon P. Suomala, Takeshi Sakurai, 1997. Wheat Import Demand in the Japanese Flour Milling Industry: A Production Theory Approach. Toronto, Canada, North Dakota State University.
World bank, 2014. Review, Estimation and Analysis of Agricultural Subsidies, Ulaanbaatar: s.n.
Amar Uuld
Ph.d student
Robert Magda
Associate Professor
Doctoral School of Management and Business Administration,
Szent Istvan University, Hungary

@ WCTC LTD --- ISSN 2398-9491 | Established in 2009 | Economics & Working Capital