Comparison among influences of human activities and economic performance on environment in eu-28
Abstract
The objectives of the study have highlight on many ways in which, over the past decade and up-to-date as well as more, cumulative pressures deriving from growth and change in economic sectors have influenced on the EU environment affecting air, water and soil quality, climate change and natural resources and discusses the policies of environmental conservation and management, based on the national and the international conditions.
The study programme consists of the following main points processed by the Statistical Program for the Social Sciences: Impacts of Societal and Economic Growth on the Environment; Economic development, Population change, Employment condition changes, Industrial production and Agriculture. In Germany the carbon dioxide (CO2) gas emission has decreased by 4,7% for the analysed period, which was about half of the decreasing average level of the EU-28. In general, decreasing industrial production and less agricultural production increase in EU could contribute to the moderate CO2 gas emission and waste generation decrease based on the international cooperation.
Keywords: SPSS, GDP growth, Gas emission, Energy resources, Waste generation
JEL Code: Q00, Q1, Q53
Introduction
The reasons are for the study and research, that the EU-28 plays important economic role in the world economy therefore this economic integration has considerable economic and social influences on the economic developing trends of the world economy. The economic developed level of the EU-28 can determine the production technological prosperity of the most of the countries of the world. The internal economic conditions and co-operations of EU-28 with themselves stimulate to extend and deep these relations for their mutual economic interests, which provide more economic favourable prosperity of the possible future technological development and more using renewable energy resources to mitigate the gas emission and negative influences on the natural environment based on the strategy of environmental conservation (Šćepanović et al, 2019). As Panwar et al. (2011) declared that the renewable technologies are considered as clean sources of energy and optimal use of these resources minimise environmental impacts, produce minimum secondary wastes and are sustainable based on current and future economic and social societal needs. Additionally, in 2016 the International Energy Agency announced that the world had changed. For the first time in hundreds of years the world was producing less greenhouse emissions than the year before without this being caused by an economic crisis (Horton et al., 2018; EFSI, 2016; EC 2010).
The economic conditions of Hungarian agricultural producers should be successful with enough efficient production in order to cover the cost of the improving even environment friendly technologies based on the output value and productivity of agricultural industry even for example, in Central-East-Europe (Szabó – Zsarnóczai, 2004; Zsarnóczai – Zéman, 2019).
The developing trends of Hungarian agricultural loans also show how the difficulties were for this efficient developing trend in agricultural sector (Széles et al., 2014). For the last decades agricultural conditions of Germany have shown the internationally accepted example to create successful farming measure for agricultural production based on the farm structure, which could provide income position in direction to more attention for the environmental conservation (Zsarnóczai, 1996). Overall, agricultural products are a major part of the EU’s regional and cultural identity, at least in part due to the diverse range of natural environments, climates and farming practices (Eurostat, 2018).
Material and Methods
The study programme consists of the following main points processed by the SPSS (Statistical Program for the Social Sciences), namely statistical programme for the social sciences (Sajtos – Mitev 2012): Impacts of Societal and Economic Growth on the Environment, which included, economic development, population and population change, employment and unemployment condition changes, industrial production and agriculture. Influences of Socioeconomics on the Environmental Conservation are as greenhouse gases emission and waste generation. Key Indicators of Environmental Quality in Hungary and the EU-28, such as air quality, water quality and climate change. The Environmental Conservation and Management is based on the climate change strategy and the controlling greenhouse Gases emission accompanying with increasing waste management, as well as, sustainable energy resource (renewable energy). The method of this study is based on the following steps, as literature studies for data collection from 1990s to up-to-date, and including in the websites of, Eurostat, European Environmental Agency, United Nations and the United Nations Environment Programme, etc.
Results and Discussion
The scientific research focuses on the analysing the differences of the economic variances from approach to the environmental conservation among the EU-28 member states. The study narrowed the number of the economic variances in order to keep analyses to main economic indicators, which can have more significant role for the economic development and growth based on the environmental conservation policy and strategy.
The main actual environmental conservation issue and economic development possibility are in order to stop or light the negative influences of human societies on the nature, which became very serious one. The special contradiction has appeared in field of the advanced technological production processes, that by the one side the technological innovation, as it is the same, and development made the possibility for the considerable natural damages because of the human activity. By the other side the same technological innovation and development can and should solve the difficulties concerning natural damages caused by the human technology.
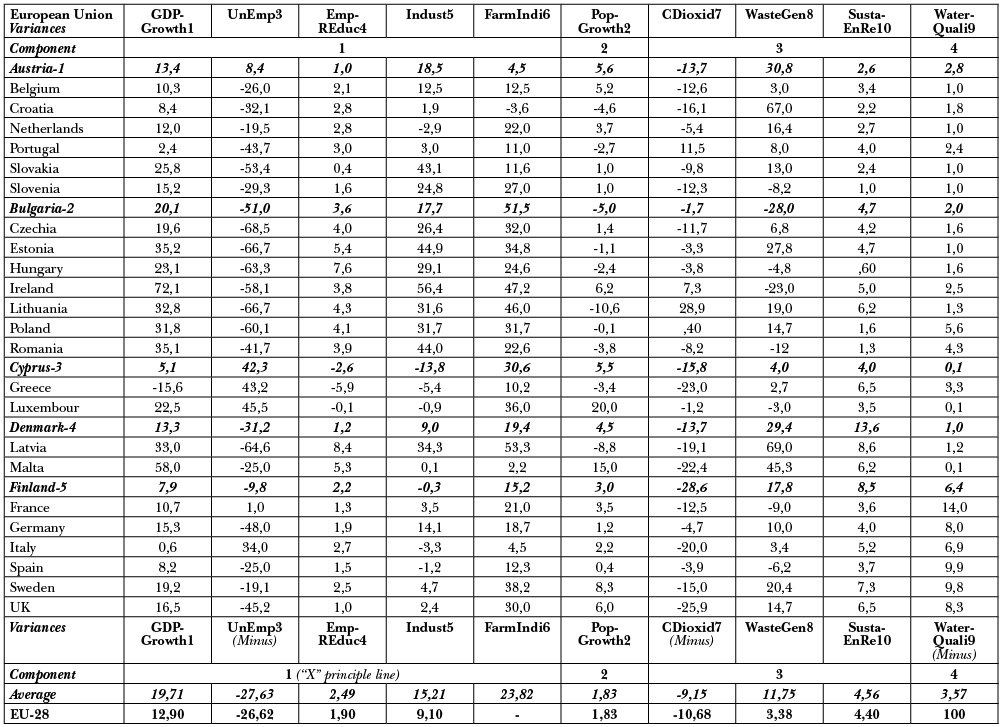
In this research the differences among different countries were overviewed based on their economic and environmental features for the period of 2010 and 2018. The Statistical Databases of International Organisation – Eurostat (the Statistical Office of the European Union) issued the wide-side database belonging to the EU-28. The table shows the data relevant to member-states in fields of ten economic variances. The data are classified into four main components consisting of economic variances in the coordinate system, which are as follows: Component-1 (“X” Line): GDPGrowth1, (Minus) UnEmp3, EmpREduc4, Indust5, FarmIndi6; Component-2 (“Y” Line): PopGrowth2; Component-3 (“Y” Line): (Minus) CDioxid7, WasteGen8, SustaEnRe10; Component-4 (“Y” Line): (Minus) WaterQuali9. The minus sign means contradiction correlations of given economic variances with the other one (Table-1; Eurostat, 2019).
In Germany the growth rate of GDP has increased only by 15,3%, which is below level of the EU-28 by 19,71%, while the unemployment rate decreased by 48,0% in inverse ratio to increasing trend by 27,63% of the EU-28. Also, the agricultural sector increased only by 18,7% accompanying with 14,1% increase in field of industrial sector, which was little less than the average level of the EU-28 by 15,21%. 1,9% was lower level of the share for educated employees in all employed in field of Tertiary education. The population of the country increased by 1,2%. In Germany (Minus) CDioxid7, the carbon dioxide gas emission has little increased by 0,4% for the period of 2010 and 2018, which was mostly half of the decreasing average level of the EU-28. This moderate greenhouse gas emission decrease was mostly resulted by the middle increase of the share of renewable energy sources (SustaEnRe10), which was 4,0%, as same as one of Portugal and Cyprus and also closed to increasing average level of EU-28. Based on the result of the renewable energy sources little increased, the waste material and waste generation could moderately increase by 10,0% under the EU average level, as 11,75 by the end of 2018. This moderate decreasing gas emission and moderate increasing waste generation were thanks to not too highly increasing level of share of renewable energy sources. Germany as the strongest economy of the EU should have led the economic development directing to more environment friendly strategy accompanying with decreasing pollution at highly level comparably to the other member states of the EU.
In Austria (Minus) CDioxid7, the carbon dioxide gas emission has considerably decreased by 13,7% for the period of 2010 and 2018, which was important comparably to the average level of the EU-28. This greenhouse gas emission decrease was mostly resulted by the middle level increase of the share of renewable energy sources (SustaEnRe10), which was 2,6%, as closed to one of Slovakia. Based on the result of the renewable energy sources moderately increased, the waste material and waste generation sharply increased by 30,8%, which was the second highest level after Croatia, naturally more than the average level in the EU-28, as 11,75 by the end of 2018. In Austria it can be experienced that the waste generation increased in inverse ratio to decreasing trend in the field of the carbon dioxide gas emission. Also, middle increasing level of the industrial production and little increasing agricultural production could contribute to the considerable carbon dioxide gas emission decrease and highly level increase of the waste generation comparably to the average level of the EU-28. Probably the considerable waste generation could be resulted by the increasing consumption of the population, because of the number of the population considerably increased, which was three times higher than the average level of this one of the EU.
In UK the growth rate of GDP has increased only by 16,5%, which is below level of the EU-28, while the unemployment rate decreased by 45,2%, The level of the share for educated employees in all employed in field of Tertiary education was at 1,0%. The population of the country increased by 6%, which was mostly resulted by the human resource inflow from other EU member states to UK. In UK, (Minus) CDioxid7, the carbon dioxide gas emission has sharply decreased by 25,9% for the period of 2010 and 2018, which was very important comparably to the average level of the EU-28. This result was the second biggest mitigation after Finland in the same time. This greenhouse gas emission decrease was mostly resulted by the considerable increase of the share of renewable energy sources (SustaEnRe10), which was 6,5%, as same as one of Greece. In result of the renewable energy sources decreased, the waste material increased by 14,7%, which was more than the average level in the EU-28, as 11,75 by the end of 2018. Also, low level of the industrial production and less agricultural production increase than in Sweden could contribute to the moderate carbon dioxide gas emission decrease.
Ireland achieved the top level in the field of prosperity and GDP growth rate by 72,1%, as the biggest increasing rate in EU-28 from 2010 till 2018. Prosperity of GDP growth rate in Ireland was partly resulted by the considerable industrial increase by 56,4%, which was the highest level in EU-28 and agricultural development increase by 47,2%, as the third biggest one after Latvia by 53,3% and Bulgaria by 51,5%. Also, the educational ratio of all population was only 3,8%, which was good in comparably to the average level of EU-28 by 2,49%. But this result of the Ireland in field of educational ratio of all population was less than 8,4% in Latvia, 7,6% in Hungary, 5,4% in Estonia, 5,3% in Malta, 4,1-4,3% in Poland and Lithuania.
In Ireland the population growth increased by 6,2%, which was mostly three times more than the average level of the EU-28 in the researched period. It is clear that the population growth could stimulate the GDP growth increase and remain a quite good and internationally accepted ratio of educated employees. The prosperity of Ireland was also stimulated by top level of the financial supports given by the EU-28 from the common financial resources in 2010 years. The adequate population growth increase accompanying with increasing ratio of educated and skilled employees. Also, the unemployment decrease contributed to increase number of employees leading to the prosperity two main sectors, namely agriculture and industry. The ambition increasing performance resulted the increasing level of the education and skill. Either industry or agriculture strengthened each other in their improving innovation development, as it is clear from the data base.
In Ireland, (Minus) CDioxid7, the carbon dioxide gas emission has increased by 7,3% for the period of 2010 and 2018, which was at the second highest level in EU-28 after Lithuania. This greenhouse gas emission effect was mostly resulted by the considerable increase of the industrial production by 56,4%, while the increase of the agricultural production was 47,2%, by little less than the one of industry. Both of these two sectors stimulated the GDP to growth to increase by 72,1%, as the highest level of the EU-28.
In France the growth rate of GDP has increased only by 10,7%, which is below level of the EU-28, while the unemployment rate creased by 1,0%. The level of the share for educated employees in all employed in field of Tertiary education was at 1,3%, which has quietly been less than the average level of the EU-28, namely 2,49% for the period of 2010 and 2018. The population of the country increased by 3,5%.
In France (Minus) CDioxid7, the carbon dioxide gas emission has considerably decreased by 12,5% for the period of 2010 and 2018, which was important comparably to the average level of the EU-28. This result was higher than the average level of the EU-28. This greenhouse gas emission decrease was mostly resulted by the increase of the share of renewable energy sources (SustaEnRe10), which was 3,6%, as same as one of Greece. Based on the result of the renewable energy sources decreased, the waste material also decreased by 9%, which was in inverse ratio to the increasing average level in the EU-28, as 11,75 by the end of 2018. Also, low level of the industrial production and the middle increase of the agricultural production could contribute to the moderate carbon dioxide gas emission decrease and considerable decrease of the waste material comparably to the average level of the EU-28.
In Denmark GDP growth has increased only by 13,3%, as lower level than average level of the EU-28 by 19,71%, while the unemployment rate in inverse ratio decreased by 31,2%. Also, the agricultural sector increased by 19,4% accompanying with 9% increase in field of industrial sector. The population increased by 4,5%. 2% was the higher share of educated employees in all employed in field of Tertiary education.
In Denmark (Minus) CDioxid7, the carbon dioxide gas emission has decreased by 13,7% for the period of 2010 and 2018, which was important comparably to the average level of the EU-27. This greenhouse gas emission decrease was mostly resulted by the considerable increase of the share of renewable energy sources (SustaEnRe10), which was 13,6%, as the first highest level increase in EU-28 at the top. In spite that the excellent result of the renewable energy sources increases, the waste material sharply increased by 29,4%, by the end of 2018. Mostly the agricultural production can be the first responsible for the increasing waste generation and materials in Denmark. Because the industrial production has increased by little, probably this sector could only contribute but little to issuing the waste materials.
In the EU-member states the correlations and significance among the economic variances were in inverse ratio to themselves, namely from one side of (Minus) UnEmp3, which decreases and to the other side of EmpREduc4, Indust5, FarmIndi6 and GDPGrowth1 increase, while the Indust5 and FarmIndi6 stimulated the GDP growth and increasing performance quietly ensures a fixed highly level of educated employees in Tertiary education including BSc, MSc and post-graduating study. In case of the increasing PopGrowth2 the unemployment rate decreases, but also the industrial, agricultural production increases therefore, the GDP growth rate increases, and also, not considerably the portion of the educated employees in all employment have increased for the period of 2010-2018 (Table-1; Table-2). In any case the unemployment rate changes are in inverse ratio to developing trend of the other economic variances, which declaration is argued in all of the four sessions of the coordinate system. The GDPGrowth1, EmpREduc4, Indust5, FarmIndi6 and PopGrowth2 decrease in inverse ratio of their own increase in the first session, while the (Minus) UnEmp3 economic variance increases, because this variance changes in inverse ratio to the other economic variances. In the third session of the coordinate system GDPGrowth1, EmpREduc4, Indust5 and FarmIndi6 increase, while the (Minus) UnEmp3 and PopGrowth2 economic variances increase, because two variances change in inverse ratio to the other economic variances. In the fourth session of the coordinate system the economic conditions of member states in this session have economic developing trends in inverse ratio to economic conditions of member states in the first session of the coordinate system.
Table-1: Main economic conditions and some environmental indicators of the EU-28 member states during 2010-2018, based on the SPSS, in percentages (%)
Source: Statistical Databases of International Organisation – Eurostat (the Statistical Office of the European Union) Database, 2019, EU-28 [Database; Online]. Eurostat, Luxembourg, 2019. Available at: https://ec.europa.eu/eurostat/; https://ec.europa.eu/eurostat/data/database
[Accessed at: the middle of June and the beginning of July, 2019].
Note: Data not available (-).
Component-1 (“X” Line): GDPGrowth1, (Minus) UnEmp3, EmpREduc4, Indust5, FarmIndi6
Component-2 (“Y” Line): PopGrowth2
Component-3 (“Y” Line): (Minus) CDioxid7, WasteGen8, SustaEnRe10
Component-4 (“Y” Line): (Minus) WaterQuali9
10 economic variances in EU-28
GDPGrowth1 = GDP and main components (output, expenditure and income). Last update: 01.07.2019. Source of data: Eurostat [online data code: nama_10_gdp]. UNIT: Chain linked volumes, index 2010=100 NA_ITEM: Gross domestic product at market prices, 2010 = 100, 2010-2018 in %. Available at:
http://appsso.eurostat.ec.europa.eu/nui/show.do?dataset=nama_10_gdp&lang=en
PopGrowth2 = Population change – Demographic balance and crude rates at national level. Last update: 06.06.2019. Source of data: Eurostat [online data code: demo_gind]. INDIC_DE: Population on 1 January – total, 2010 = 100, 2010-2018, in %. Available at:
http://appsso.eurostat.ec.europa.eu/nui/show.do?dataset=demo_gind&lang=en
UnEmp3 = Unemployment by sex and age – annual average. Last update: 01.07.2019. Source of data: Eurostat [online data code: une_rt_a]. AGE: Total UNIT: Thousand persons SEX: Total, 2010 = 100, 2010-2018, in %. Available at:
http://appsso.eurostat.ec.europa.eu/nui/show.do?dataset=une_rt_a&lang=en
EmpREduc4 = Employment rates by sex, age and educational attainment level (%) – annual data. Last update: 23.05.19. Source of data: Eurostat [online data code: lfsa_ergaed]. SEX: Total AGE: From 25 to 64 years ISCED11: Tertiary education (levels 5-8) including BSc, MSc, post-graduating study UNIT: Percentage, in % between: 2010-2018. Available at:
http://appsso.eurostat.ec.europa.eu/nui/show.do?dataset=lfsa_ergaed&lang=en
Indust5 = Production in industry – annual data. Last update: 03.07.2019. Source of data: Eurostat [online data code: sts_inpr_a]. INDIC_BT: Volume index of production NACE_R2: Mining and quarrying; manufacturing; electricity, gas, steam and air conditioning supply S_ADJ: Calendar adjusted data and not seasonally adjusted data, UNIT: Index, 2010=100, 2010-2017, in %. Available at:
http://appsso.eurostat.ec.europa.eu/nui/show.do?dataset=sts_inpr_a&lang=en
FarmIndi6 = Farm indicators by agricultural area, type of farm, standard output, legal form and NUTS 2 regions. Last update: 06.05.2019. Source of data: Eurostat [online data code: ef_m_farmleg]. Standard output – euro, 2010 = 100, 2010-2016, in %
FARMTYPE: Total, LEG_FORM: Total, SO_EUR: Total, AGRAREA: Total, TIME: 2016;
FARMTYPE: Total, LEG_FORM: Total, SO_EUR: Total, AGRAREA: Total, TIME: 2010. Available at:
http://appsso.eurostat.ec.europa.eu/nui/show.do?dataset=ef_m_farmleg&lang=en
CDioxid7 = Carbon dioxide, Air emissions accounts by NACE Rev. 2 activity. Last update: 11.02.2019. Source of data: Eurostat [online data code: env_ac_ainah_r2]. AIRPOL: Carbon dioxide UNIT: Tonne NACE_R2: Total – all NACE activities, 2010 = 100, 2010-2017, in %. Available at:
http://appsso.eurostat.ec.europa.eu/nui/show.do?dataset=env_ac_ainah_r2&lang=en
WasteGen8 = Generation of waste by waste category, hazardousness and NACE Rev. 2 activity. Last update: 13.06.2019. Source of data: Eurostat [online data code: env_wasgen]. HAZARD: Hazardous and non-hazardous – Total UNIT: Tonne WASTE: Total waste NACE_R2: All NACE activities plus households, 2010 = 100, 2010-2016, in %. Available at:
http://appsso.eurostat.ec.europa.eu/nui/show.do?dataset=env_wasgen&lang=en
WaterQuali9 (Water Quality) = Renewable freshwater resources. Last update: 19.11.2018. Source of data: Eurostat [online data code: env_wat_res]. WAT_PROC: Precipitation UNIT: Million cubic metres. Precipitation – long-term annual average (the minimum period taken into account for the calculation of long-term annual averages is 20 years), 2010 = 100, 2010-2017 in % in EU-28, except in the case of Bulgaria 2012 = 100; Croatia and Estonia 2011 = 100; and Denmark 2009 = 100 because the data of these member states are not available in the year of 2010. In case of Greece data not available only in 2017.
http://appsso.eurostat.ec.europa.eu/nui/show.do?dataset=env_wat_res&lang=en
SustaEnRe10 = Share of renewable energy sources. Last update: 14.06.2019. Source of data: Eurostat [online data code: nrg_ind_ren]. NRG_BAL: Renewable energy sources UNIT: Percentage, in % between: 2010-2017. By the end of 2017:
• about 30% or more = Estonia, Austria, Denmark, Latvia, Finland, Sweden;
• less than 10% or about 10% = Luxembourg, Netherlands, Malta, Belgium, Cyprus, UK, Ireland, Poland.
Available at: http://appsso.eurostat.ec.europa.eu/nui/show.do?dataset=nrg_ind_ren&lang=en
Cluters of the analysed EU-28 member-states
Cluster (1), 7 member states: Austria, Belgium, Croatia, Netherlands, Portugal, Slovakia,
Slovenia
Cluster (2), 8 member states: Bulgaria, Czechia, Estonia, Hungary, Ireland, Lithuania, Poland,
Romania
Cluster (3), 3 member states: Cyprus, Greece, Luxembourg
Cluster (4), 3 member states: Denmark, Latvia, Malta
Cluster (5), 7 member states: Finland, France, Germany, Italy, Spain, Sweden, UK
Table-2: Correlation Matrix

Source: Statistical Databases of International Organisation – Eurostat (the Statistical Office of the European Union) Database, 2019, EU-28 [Database; Online]. Eurostat, Luxembourg, 2019.
Conclusion
Because the GDP growth, educated employees in Tertiary education from 25 to 64 years (EmpREduc4), industrial production (Indust5) and agricultural industry (FarmIndi6) mostly decrease or little increase in Netherlands, Spain, Finland, Italy, UK, Sweden, Hungary and France for the period of 2010 and 2018, while in some of these countries the decreasing or little increasing industrial production (Indust5) and agricultural production (FarmIndi6) stimulated the GDP growth for decreasing or little increasing. Therefore, the decreasing performance quietly ensures a fixed low or lower level of educated employees in Tertiary education (EmpREduc4), while also the population growth (PopGrowth2) have decreased for the period of 2010-2018. Because the unemployment by annual average (UnEmp3) increases in the fourth session of the coordinate system based on its inverse ratio to the other economic variances decrease. The share of the renewable freshwater resources (SustaEnRe9) are not depending on the changes of the industrial production and waste generation, in spite that the inverse ratio can be followed by the mathematical model calculation based on the data base of the Table-1.
References
EC (European Commission), 2010. Energy 2020. a strategy for competitive, sustainable and secure energy. 2010.
EFSI (European Fund for Strategic Investments, 2017): EFSI work. Available at:
http://www.eib.org/en/efsi/index.htm; http://www.eib.org/en/efsi/index.htm;
http://www.eib.org/en/efsi/what-is-efsi/index.htm
Eurostat (2018): Statistical Databases of International Organisation – Eurostat (the Statistical Office of the European Union) Database, 2019, EU-28 [Database; Online]. Eurostat, Luxembourg, 2019. Available at:
https://ec.europa.eu/eurostat/; https://ec.europa.eu/eurostat/data/database
[Accessed at: the middle of June and the beginning of July, 2019].
Horton T, Bolt M, Prather C, Manobianco J, Adams M.L, 2018. Airborne Sensor Network for Atmospheric Profiling. Wireless Sensor Network, 10, 93-101.
Panwar N L, Kaushik S C, Surendra Kothari, 2011. Role of renewable energy sources in environmental protection: A review. Renewable and Sustainable Energy Reviews Volume 15, Issue 3, April 2011, Pages 1513-1524, Elsevier Journals
Sajtos L, Mitev A, 2012. SPSS research and data analysing handbook. (SPSS kutatási és adatelemzési kézikönyv). Alinea Publishing, p. 402
Šćepanović S, Warnier M, Nurminen J K, 2019. Erratum to “The role of context in residential energy interventions:
A meta review” Renewable and Sustainable Energy Reviews, Issue 04, 77 (2017) 1146–1168.
Szabó L, Zsarnóczai J S, 2004. Economic conditions of Hungarian agricultural producers in 1990s. AGRICULTURAL ECONOMICS-ZEMEDELSKA EKONOMIKA 50: 6 pp. 249-254, 6 p.
Széles Zs, Zéman Z, Zsarnóczai J S, 2014. The developing trends of Hungarian agricultural loans in term of 1995 and 2012. AGRICULTURAL ECONOMICS-ZEMEDELSKA EKONOMIKA 60: 7 pp. 323-331, 9 p.
Zsarnóczai J S, 1996. Németország mezõgazdasági helyzete az 1990-es évek elsõ felében (Agricultural conditions of Germany in the first half of 1990s). STATISZTIKAI SZEMLE / Statistical Review / 74(3): pp. 230-238.
Zsarnóczai J S, Zéman Z, 2019. Output value and productivity of agricultural industry in Central-East-Europe. AGRICULTURAL ECONOMICS-ZEMEDELSKA EKONOMIKA 65: 4 pp. 185-193, 9 p.
Khalif, Abdussalam Ashour
Doctoral School of Management and Business Administration, Faculty of Economic and Social Sciences, Szent István University

@ WCTC LTD --- ISSN 2398-9491 | Established in 2009 | Economics & Working Capital