Economic competitiveness of Hungary by impact of foreign trade
Abstract
The analysis of foreign trade and trade relations is of paramount importance, as it enables producers, from small and medium-sized enterprises to large enterprises, companies and multinational companies, to recover their production costs and capital, surplus revenue and realization of profit. Hungary, for reasons explained, is performing poorly.
For the analysis of competitiveness, the more reliable WEF, Eurostat, sources enable static and dynamic comparisons and the exploration of correlations.
Hungary is also not good among the Central and Eastern European (CEE) countries. We are particularly bad at institutions (114), macro-environment (47), labour market efficiency (80), technological skills (54), business skills (113) and innovation (80). Hungary ranked 60th out of 137 countries in the World Economic Forum’s 2017-2018 competitiveness ranking. Hungary has a relatively good position in the field of employment competitiveness, and also approach the good performance in the case of the employment rate and the average tax wedge and families with 2 children. Research and development spending are far below the 1,8 percent (as a percentage of GDP) target for 2020. The perception of the efficiency of the commodity market is good in Hungary, while it is less favourable in the labour market.
In order to make Hungarian development faster, new ideas should be brought to the fore: – the internationalization of trade can bring great benefits to our country, – intensifying capital inflows can improve our situation, in global competition, the lasting corporate competitive advantage is provided by the soft factors of innovation, knowledge transfer and competitiveness.
Keywords:
Innovation, Labour market efficiency, Small and medium-sized enterprises
Commodity market, Surplus revenue
Introduction
The analysis of foreign trade and trade relations is of paramount importance, as it enables producers, from small and medium-sized enterprises to large enterprises, companies and multinational companies, to recover their production costs and capital, surplus revenue and realization of profit. Hungary, for reasons explained, is performing poorly. Due to this disadvantage, a thorough examination of competitiveness is important, which gives the thesis topicality.
- On the basis of the main objective, I would like to present the situation of Hungary, to evaluate domestic competitiveness, presenting the organizational possibilities for cooperation.
- The second objective is to carry out an analysis of the development of Hungary’s foreign trade, presenting opportunities and analysing the data.
Preparation for international competitiveness requires domestic markets. Related and supporting sectors and industries are significant (Porter, 2000). Competitiveness has been analysed by many authors, including their detailed work on the topic (Chikán, 2017; Grauwe, 2017; Kotler 1967; Annoni – Kozovska, 2010; Atkinson, 2013; Krugman, 1991; Krugman, 1994), who agree that the definition is universally accepted to this day. According to Bozsik (2011), the examination of production factors alone is not sufficient. Specialized expertise can be an important resource for nations. Demand conditions – industrial and individual consumers – as well as corporate strategy and market competition are also included. The concept of competitiveness is used by several disciplines, and the approach can be interpreted at the level of economics and management, and can be interpreted at the national, regional, sectoral, enterprise and product level (Schwab – Sala-i-Martin, 2017; Samuelson- Nordhaus, 1992).
Competitiveness and trade are interrelated, I present the situation and changes in international and domestic trade. I estimate the foreign trade of our country based on the latest Central Statistical Office data. I prepared some hypotheses concerning the study as follows:
Hypothesis-1: Based on trends and forecasts, Hungary’s development is lagging behind, identifying areas where we need to change to achieve faster growth.
Based on trends and forecasts, Hungary is lagging behind other EU Member States, which I will examine in detail. The main areas where the country is not performing well are:
- institutional backlog,
- poor performance in primary education,
- skilled labour is not available in line with needs,
- our technological capability is weak,
- the sophistication of the business sector is very problematic,
- our innovation position is bad.
Hypothesis-2: Hungary’s competitiveness needs to be assessed in the global marketplace, and WEF (World Economic Forum) analyses can provide guidance in this area. Hungary’s competitiveness can only be objectively measured in global markets, and various rating agencies provide a good basis for this.
Hypothesis-3: The development dynamics of the country are lagging behind, so in order to keep up with our rapid development, it is advisable to implement new ideas (credit programs, application systems, increasing the role of high-tech industries, prioritizing innovation and R&D) to find the desired directions of development.
With the correct preparation and implementation of my research I want to give methodologically sound answers to confirm the hypotheses.
Material and Methods
For the analysis of competitiveness, the more reliable VEF, Eurostat, sources enable static and dynamic comparisons and the exploration of correlations. For time series analysis, I checked the WEF database with Eurostat, data. The time series data of the VEF database between 2005 and 2016 were analysed with linear trends. The benefits of this longer period also reduce the importance of minor data errors and provide opportunities for forecasting. The trend calculations in the complete statistical survey system yielded measurable results for the main direction of change, both for the EU Member States and for domestic changes: – where is our country in the EU 28 environment, – trends in change and convergence, – what is the development direction of our country (Eurostat, 2018; IMF, 2018; EC, 2018).
I think that the examination of the indicators that are important in the EU principles will give results that can be evaluated both for the Hungarian and the European economy. Such areas include: – inflation, – public debt, – the budget balance, – GDP per capita, – export rate, – import ratio, – national savings.
In accordance Stam (2010), the concept of a broader research, applied research, analytical and problem-solving synthesizer. In secondary research, I use the data and results of others. The main topics analysed were: – interpretation and measurement of competitiveness, – innovation, research and development, – competitiveness program, – network and clusters, – factors of competitiveness, – the state of trade (see also in Samuelson – Nordhaus, 1992).
Some experts emphasize that the ability of companies, industries, regions, nations and transnational regions to create relatively high incomes and relatively high levels of employment over time while being exposed to foreign (global) competition (Lengyel, 2012; see mere in Magda et al, 2017 and Magda 2017). According to the competition the financial strategy and management at national level should be extended similarly to the firm–level, in which role of governance, organizing, planning and controlling according to well-defined goal criteria; preparation and realization of raising capital owners even in performance including the agricultural industry (Széles et al, 2014; Lentner, 2018). The main aim for EU, Hungarian and also German agricultural producers was to increase their capital accumulation to implement improvement of production technology in order to be competitive on the world and domestic markets (Szabó-Zsarnóczai 2004; Zsarnóczai, 1996; Powell-Gianella, 2010). In EU-28 subsidies on production were concentrated on developing technology by subsiding consumption of fixed capital. Generally, the value of subsidies was 87% of value of consumption of fixed capital in 2016 (Zsarnóczai-Zéman, 2019). Therefore, I can always observe basic trends (increase, decrease, etc.) in the evolution of time-varying presence. Based on the experience of the observed phenomena, I can write a function that expresses the basic trend of temporal change concerning the financial issues and competitiveness of the firms.
Results and Discussion:
Evaluation of competitiveness
The MNB (Hungarian National Bank, 2018) depicts the most important aspects needed to improve competitiveness in a pyramid model, culminating in sustained catch-up and growth. Whatever the problem, we look at how to improve productivity. Hungary is also not good among the Central and Eastern European (CEE) countries. We are particularly bad at institutions (114), macro-environment (47), labour market efficiency (80), technological skills (54), business skills (113) and innovation (80).
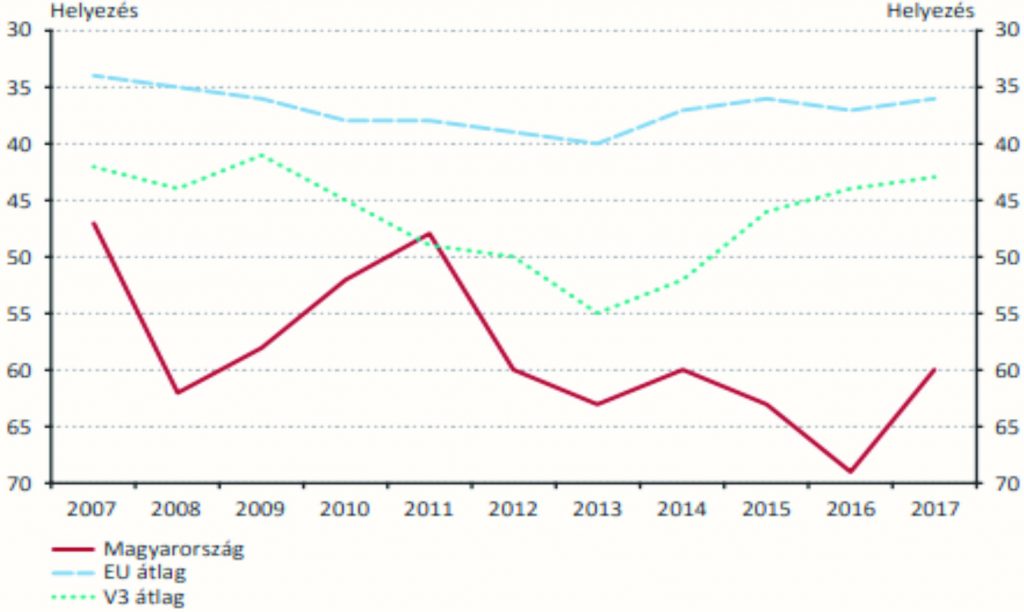
Hungary ranked 60th out of 137 countries in the World Economic Forum’s 2017-2018 competitiveness ranking. The Czech Republic ranked 31st, Poland 39th and Slovakia 59th. Hungary ranks 24 out of the 28 EU Member States. Although most of the indicators examined are subjective, only 26% of the indicators are objective. The WEF examines 12 pillars in the competitiveness study, the first four pillars analyse the fundamentals, the next six deal with efficiency-enhancing factors, while the last two deal with innovation and economic complexity. The change in WEF rankings is deteriorating and the EU average and V3 average are significantly higher than the rankings for Hungary (Figure 1; HCSO, 2018).
Figure 1: Position of Hungary in the region and the EU_28
Source: WEF (World Economic Forum, 2018): Global Competitiveness Index, 2007-2017
Health care is relatively good, but significantly worse in primary education. The availability of skilled labour remains problematic. Secondary and higher education are more favourably regarded. The efficiency of the commodity market is good. Significant improvements have been made in technological and financial market developments, but the sophistication of the business sector is problematic. The size of the market is favourable due to Hungary’s openness, but our innovation position is poor.
The 2010-2016 period brought significant improvements in some areas (Eurostat, 2018; European Committee; MNB, 2018.). In terms of macroeconomic indicators, labour productivity lags behind V3 and the EU average. With higher wages, entrepreneurs pay more attention to mechanization, which can improve productivity. Hungary went in that direction. Hungary has a relatively good position in the field of employment competitiveness, and also approach the good performance in the case of the employment rate and the average tax wedge and families with 2 children. State competitiveness figures are not favourable. Public administration expenditures and the number of procedures required for building permits in Hungary are significant, with only the administrative administration on the Internet developing well. Business competitiveness is improving, but there is still room for improvement.
R&D (Research and Development) and innovation are lagging behind in every respect. Research and development spending are far below the 1,8 percent (as a percentage of GDP) target for 2020, the last one in the summary innovation index. We are also among the weakest in the EU Digital Economy and Society Index. We have a moderate performance in the competitiveness of the energy market. The energy intensity of the economy is not showing good value. Demography and social fabric are improving. The fertility rate is constantly rising and we are well on the HDI index.
In the field of education, the results of the PISA survey (Programme for International Student Assessment, 2018) are poor, and fundamental changes are needed. Public education spending is extremely low compared to other countries, which could pose serious problems for the future. The proportion of science graduates is low and changes in education are needed. We are far from the EU average in terms of health, and healthy life expectancy is low. The number of doctors per thousand inhabitants is small. There is also room for improvement in the competitiveness of the banking system, with a low proportion of internet banking users. Hungary is far the last in terms of asset-related operating expenses and interest income.
Factors that undermine competitiveness
In terms of pillars, we have one of the worst performances in terms of innovation. Especially domestic SMEs (Small and medium scale enterprises) are lagging behind in this area. The percentage of SMEs introducing product or process innovation is low and few SMEs have introduced internal innovation. Domestic SMEs have difficulty accessing R&D money. (SBA 2018).
IMD Ranking Results
Hungary ranked 52nd out of 63 countries in the 2017 in IMD Smart City Index 2019 ranking. The countries surveyed are usually among the more advanced, so Hungary is at the bottom of the list. According to the IMD, Hungary is lagging far behind in the competitive sector and in government efficiency, but our economic performance is considered good. In terms of infrastructure, Hungary is ahead of the CEE (Central-East European) region. The results of international trade and the sub-groups measuring them are particularly good. The foreign trade balance is positive and inflation is moderate. On the other hand, the country is doing poorly in international investment, due to a decline in FDI inflows in 2016. Hungary’s position in the subcategories is illustrated in data base of IMD. Economic performance is ranked 36th, but government efficiency (54th) and private sector efficiency are poor. The infrastructure (rank 41) is overall good.
The 11-year trend of competitiveness factors
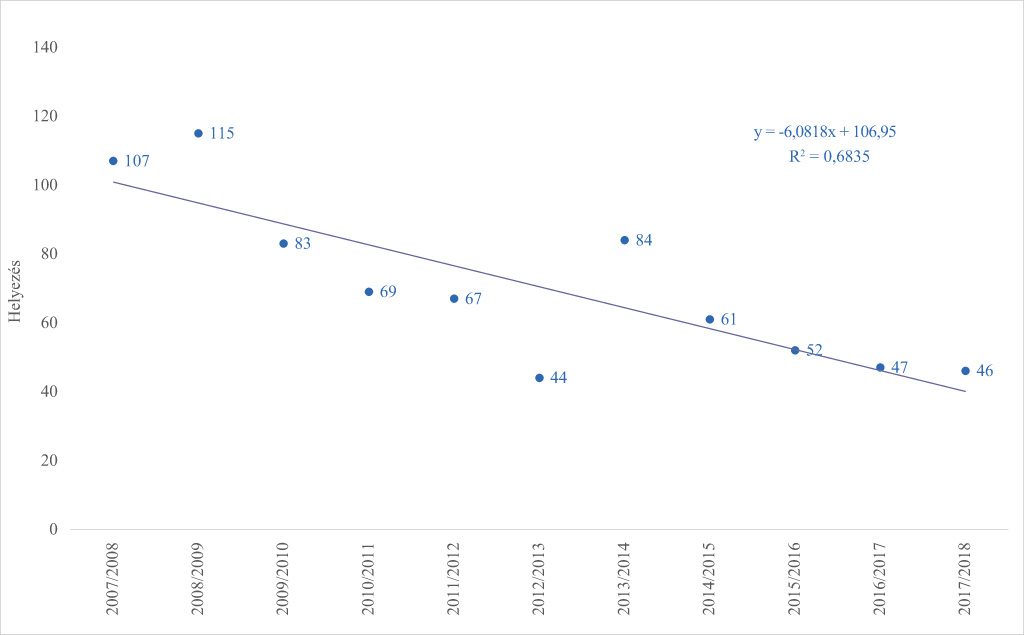
There is a significant improvement in the macro-environment. From its 155th place in 2008/2009, the country is now in 46th place. The pillar examines, among other factors, the budgetary balance as a proportion of GDP, the evolution of gross government debt ratio and the net saving position of the population on the basis of objective indicators (Figure 2).
Figure 2: Macro position trend of Hungary
Source: WEF (World Economic Forum, 2018): Global Competitiveness Index, 2007-2017
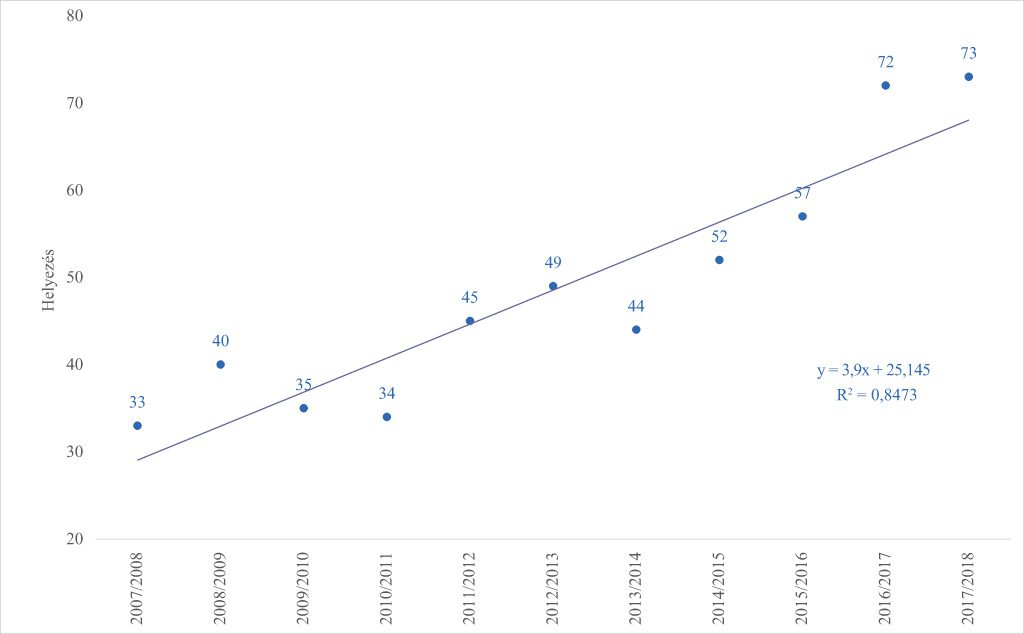
Health care and primary education are combined. We are consistently getting worse in terms of the trend. The low proportion of students also worsens the perception. Hungary is in a relatively favourable position in terms of health indicators. The results of higher education and training are also deteriorating (Figure 3).
Figure 3: Trend of the highly education in Hungary
Source: WEF (World Economic Forum, 2018): Global Competitiveness Index, 2007-2017
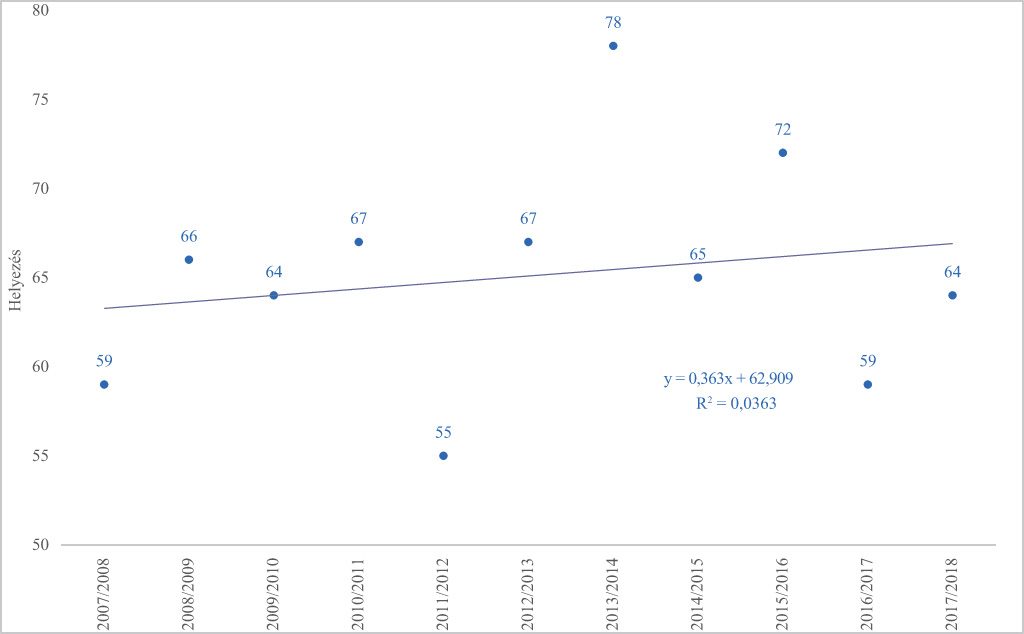
The perception of the efficiency of the commodity market is good in Hungary, while it is less favourable in the labour market. Business start-up regulation has continued to improve, while the intensity of local competition is below average. The availability of skilled labour has not been realized and needs to be changed here.
Figure 4: Efficiency of product market conditions in Hungary
Source: WEF (World Economic Forum, 2018): Global Competitiveness Index, 2007-2017
The results show a slight deterioration according to the trend (Figure 4). The trend of labour market efficiency is also deteriorating. Financial markets developed significantly in 2017. Ranked 45th since 2007. There has also been a significant improvement in technological development. This development is due to the widespread use of wired internet and bandwidth. By this, Hungary achieved its former relatively good position. Hungary is doing well in terms of market size. The open economy offers access to many export markets. After a relatively small decline, the ranking numbers are even. Our business sector readiness is bad. The figures also lag behind the regional average. In the field of innovation, there is a steady decline in rankings. There was a period between 2011 and 2013 when our results improved, but today it is down. Our ranking improved in the last year, but our backlog is still significant. An examination of the 12 pillars indicates that there is a need for significant improvements in competitiveness factors. Domestic competitiveness is lagging behind that of EU Member States and V3 countries. The country has developed significantly in recent years and this trend must be maintained.
Trade balance and competitiveness
Trade relations between competitive economies are generally conducted with an improving exchange rate. What Hungary can sell on the world market and under what conditions is an important competitiveness issue for Hungary as well. In the case of services Hungary has better opportunities, and exports expanded more strongly.
Hungary’s foreign trade
GDP increased by 23 percent between 2013 and 2018. In 2018, it was the largest increase in the last six years (4,9%). Our country’s economy is extremely open in Europe. The contribution of net exports to GDP growth varied. Household consumption and investment growth in recent years have boosted imports, resulting in a deterioration of the external trade balance. The balance of trade slowed down GDP growth, while the service’s foreign trade activity contributed to the growth of the national economy each year. The share of services in foreign trade activity has been welcomed based on the components of the external trade balance at current prices for 2018. The decrease in the assets was caused by the decline in the trade balance, as in 2018 the increase in value of exports (7,3%) was significantly lower than that of imports (11%) (also see HCSO, 2018).
In 2018, the process started in 2017 continued, whereby the forint price level of foreign trade in goods increased in exports and imports, while the exchange rate deteriorated. In 2018, the forint price level of exports increased by 3,0%, while that of imports increased by 4,0%, which is the most significant increase in the past half-decade. The exchange rate deteriorated by 1,0%, the highest in the last six years. The trade balance with EU-28 is positive, but with non-EU countries it is negative.
The increase in imports is mainly due to the purchase of energy imported from Russia. Our most important trading partner is Germany, both in terms of exports and imports. In 2018, we were active in our foreign trade in services. The role of tourism, transport and business services is welcome. All these factors have a positive effect on competitiveness. Germany is also leading the service, but the United Kingdom and the United States also play an important role.
Other effects of foreign trade
Economic growth can be achieved by increasing employment and productivity. An additional indicator of productivity is Total Factor Productivity (TFP). Policies aimed at promoting technological development through organizational change, labour mobility, increased investment in R&D and the use of information and communication technologies are key factors in the growth of TFP. The EU’s development is being held back by the unfavourable demographic situation and the slow growth of labour productivity.
Trade and competitiveness are intertwined. EU external competitiveness policies should help to reduce “behind the scenes” costs. Business, small and medium-sized enterprises (SMEs) are now recognized as one of the main drivers of the EU’s economic performance. They enable structural change, innovation and employment growth.
Studies show that fast-growing companies are present in every industry and every country. Not only are they using high technology primarily, they are also good for taking advantage of the market opportunities. Socially responsible entrepreneurs and economic leaders are key to the well-being of our societies. CSR (Corporate Social Responsibility) is a concept whereby companies integrate social and environmental considerations into their business operations and their relationships with stakeholders on a voluntary basis.) There is a positive correlation between competitiveness and corporate social responsibility. With more and more companies, CSR is becoming indispensable for competitiveness.
Analysis of trends and analysis of inflation
I analysed the linear trend of annual inflation in Hungary between 2005 and 2016. According to the study, there was a significant decrease in the error period of 1% at the error rate, with a significant coefficient “b” of 0,5 representing the decreasing tendency. Inflation fell from a peak of 7,94% in 2007 to practically 2 years below 0. Looking at the European Union, the picture is mixed. Maximum values increased for some states. The chart shows the maximum and minimum inflation rates and the linear trend coefficients between 2005 and 2016 in the EU countries. In developed European countries, inflation is low, decline is relatively low, and annual volatility is also lower. These countries are less affected by inflationary pressures and are able to cope with price changes.
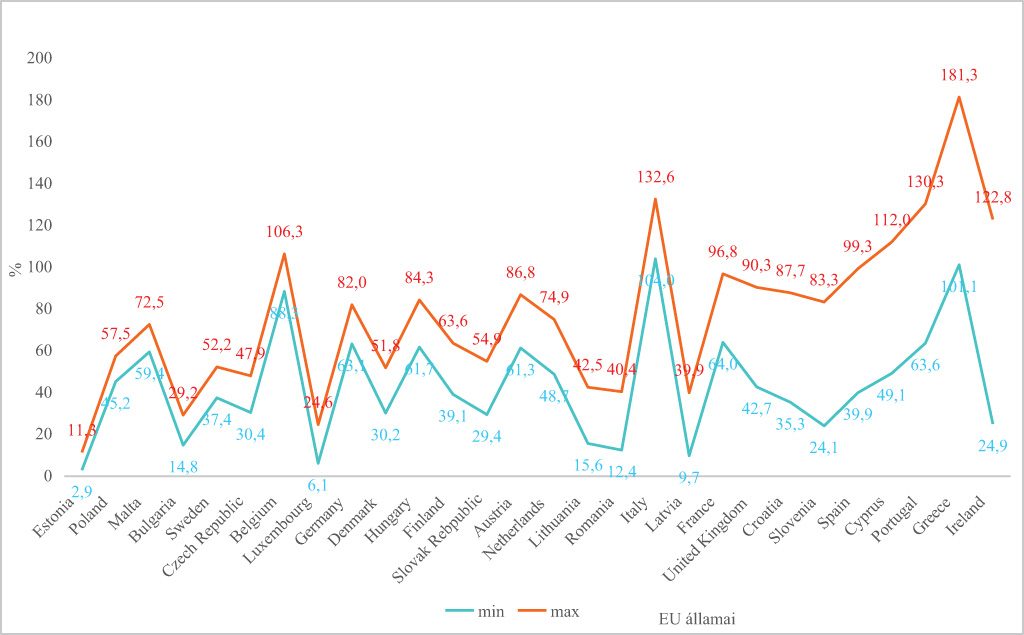
Change in government debt. Domestic debt as a percentage of GDP is growing strongly in the first third of the period, and will decline sharply from 2010 onwards. Its value in Hungary ranged from 61% to 85%. Public debt is less correlated with economic development, with both the UK and Austria fluctuating between 40% and 90%. The worst result was for Greece, with extreme values between 100 and 180%. Belgium (106%) and Italy (133%) have extremely high debt ratios with a well-functioning economy (Figure 5).
Figure 5: Minimum and maximum values of the central governmental debt in percent of GDP in EU member states between 2005 and 2016
Source: WEF (World Economic Forum, 2018): Global Competitiveness Index, 2007-2017
Balance of the budget. The budget deficit is declining in the majority of the EU Member States, including Hungary. According to the linear trend, this indicator is strongly decreasing in Hungary. It decreased from an initial 9% to 4% by the end of the period under examination. Hungary achieved the greatest improvement in this respect. Fluctuations in the budget balance may occur even with a stagnating trend in equilibrium, as indicated by the low value of the coefficient “b” and the high standard deviation of the budget and / or balance sheet result, such as Cyprus, Slovakia and Lithuania. Countries with two extreme ranges include Italy, Malta, Luxembourg, Austria, Germany, Croatia and Belgium. Hungary’s large budget minimum and maximum intervals are accompanied by strong improvements.
Linear trend of GDP per capita in Hungary. The linear trend of GDP per capita in Hungary shows continuous and significant growth. In many cases, GDP growth only partially reflects economic developments, but there is no other widely accepted indicator. The result is also distorted by the profit repatriation of multinational companies settled in Hungary, but the use of GDP is still widespread. The European GDP per capita figures for 2007-2018 are presented in 12 annexes. Gross national savings. In terms of gross national savings, Hungary belongs to a very large range of extreme values, but the trend is improving. The value of the coefficient “b” shows a significant increase in the range of 1,05% / year, 13,1 and 27,1% of GDP. The coefficient b is similar in Malta, Bulgaria and Romania.
Main results of the researches according to the hypotheses mentioned above, which can be summarized, result based on the secondary source, as follows:
According to Hypothesis-1: In the evaluation of Hypothesis 1, based on trends and forecasts, areas where Hungary lags far behind the more advanced states have been identified. Areas where more development effort is needed include: – the efficient functioning of the institutions, – primary education, – training the demand for labour, – technological preparedness (4th industrial revolution), – sophistication of the business sector, – rapid development of innovation (Ministry of New Technology and Innovation).
According to Hypothesis-2: Hungary’s competitiveness can only be objectively measured in global markets, and various rating agencies provide a good basis for this.
According to Hypothesis-3: In order to make Hungarian development faster, new ideas should be brought to the fore: – the internationalization of trade can bring great benefits to our country, – intensifying capital inflows can improve our situation, in global competition, the lasting corporate competitive advantage is provided by the soft factors of innovation, knowledge transfer and competitiveness.
Conclusions
I concluded the analysis of the factors influencing the competitiveness of EU member states. Hungary’s current position together with the identification of the tendencies in changes is another important area of research. The presentation of the existing situation of foreign trade is of utmost importance since it enables producers to cover production costs and have a positive return on capital. This research examines some cases of Hungary.
Competition has grown global by nowadays. Companies may have sustained competitive advantage through capability to innovate, knowledge creation and knowledge-transfer. The first part of my dissertation is dedicated to the interpretation and explanation of competitiveness and its measurement. This area includes innovation and research and development, in which Hungary is doing rather poorly.
In my analysis I rely on the Global Competitiveness Report 2017/2018 of the World Economic Forum (WEF). The examined 12 pillars enabled me to register underdeveloped areas on the basis of which the main directions of development may be determined. The competitiveness program of MNB, the central bank of Hungary, is also introduced and analysed. The competitiveness program of MNB is summarised 330 points, proposals cover all important areas.
References
Annoni, A. – Kozovska, K. (2010): EU Regional Competitiveness Index, JRC Report (http://composite-indicators.jrc.ec.europa.eu/Document/RCI_EUR_Report:updated.pdf)
Atkinson, R. D. (2013): Competitiveness. Innovation and Productivity Clearing up the Confision. The Information Technology & Innovation Foundation, Washington
Bozsik N. (2011): Nemzetközi gazdaságtan I. Nemzetközi Kereskedelem és versenyképesség. (Internatioanl economics. I. International trade and competitiveness) SALDO Kiadó Kft (Publishing Ltd.) Budapest
Chikán A. (2017): Magyarország versenyképessége. (Competitveness of Hungary) Rotary Club Eger, PPT elõadás (Lecture), 2017. május 9. 1-35. dia
EC (European Commission), COM (2018) 232
https://ec.europa.eu/transparency/regdoc/?fuseaction=list&n=10&adv=0&coteId=1&year=2018&number=232&version=F&dateFrom=&dateTo=&serviceId=&documentType=&title=&titleLanguage=&titleSearch=EXACT&sortBy=NUMBER
EUROSTAT (2018): https://ec.europa.eu/eurostat/web/lucas/data/primary-data/2018
Grauwe, P. De (2017): The Limits of the Market, Oxford University Press
Hungarian Central Statistical Office (HCSO, 2018): Tables (STADAT) – Themes
https://www.ksh.hu/engstadat, https://www.ksh.hu/stadat_long
MNB (Hungarian National Bank, 2018) Hungarian National Bank’s Competitiveness Program (2018)
http://abouthungary.hu/blog/here-is-the-national-banks-competitiveness-program/
IMD Smart City Index 2019, https://www.imd.org
IMF (2018): IMF Annual Report 2018, Building a Shared Future
https://www.imf.org/external/pubs/ft/ar/2018/eng/spotlight/harnessing-technology-for-good/
Kotler P. (1967): Marketing Management. Prentice Hall Englewood Cliffs
Krugman, P. (1991): Geography and Trade. MIT Press, Cambridege (MA)
Krugman P. (1994): Competitiveness: A Dangerous Obsession. Foreign Affairs, Vol. 73 (2) 28-44. pp.
Lengyel I. (2012): Regionális növekedés, fejlõdés, területi tõke és versenyképesség. (Regional growth, development, local capital and the competitiveness). In: Bajmócy Z. – Lengyel I. – Málovics Gy. (szerk.): Regionális innovációs képesség, versenyképesség és fenntarthatóság. (Regional innovetive capability, competitiveness and sustainability). JATEPress, Szeged, 151-174. pp.
Lent-ner Cs (2018): Convergence in central banking regulation – what EU candidates in South -East Europa can learn from Hungarian experience. JOR Jahrbuch für Ostrecht. Band 59. (2018) 2. Halbband. ISSN 0075-2746pp. 383-398
Magda S, Marselek S, Magda R. (2017): Az agrárgazdaságban foglalkoztatottak képzettsége és a jövõ igénye. Gazdálkodás 61. évf/year. 5. sz/number. pp. 437-458. (Skill of employees in agricultural industry and the demand of the future, Agricultural Management)
Magda R. (2017): The role of human resource management 1 in the rural area in Hungary. Social and Economic Revue 151, 33-38. pp.
PISA survey (Programme for International Student Assessment, 2018): PISA Data Analysis Manual: SPSS and SAS, Second Edition. https://www.oecd.org/pisa/data/
Porter M E (2000): Locaion, Competition, and Economic Development: Local Clusters in a Global Economy. Economic Development Quaterly (No. 1) 15-34. pp.
Powell, W. W. – Gianella, E. (2010): Collective Innovation and Innovators Net Work. In: Hall, B. H. – Rosenberg, N. (eds.) Handbook of the Economics of Innovation. Chapter 13. Vol. 1. North Holland, 575-605. pp.
Samuelson P A, Nordhaus W D. (1992): Közgazdaságtan III. Alkalmazott közgazdaságtan a mai világban. Közgazdasági és Jogi Könyvkiadó (Publishing), Budapest (Economics III. Volume, Applied economics in the actual world economy)
Szabó L, Zsarnóczai J S (2004): Economic conditions of Hungarian agricultural producers in 1990s. Agricultural Economics – Czech, (Zemedelska Ekonomika- Czech Republic). 50: 249–254.
Schwab, K. – Sala-i-Martin, X. (2017): The Global Competitiveness Report 2017-2018. World Economic Forum, 1-400. p.
SBA (Small Business Act, 2018): SBA for Europe Fact Sheet: 2018 SBA Fact Sheet — Hungary
Stam, E. (2010): Growth beyond Gibrat: firm growth processes and strategies Small Business Economies (Vol. 35) 129-135. pp.
Széles Zs, Zéman, Z, Zsarnóczai J S (2014): Developing trends in Hungarian agricultural loans in term of 1995 and 2012. Agricultural Economics (Zemedelska Ekonomika- Czech Republic). 60, 2014 (7): 323-331.
Zsarnóczai J S (1996): Németország mezõgazdasági helyzete az 1990-es évek elsõ felében (Agricultural conditions of Germany in the first half of 1990s). STATISZTIKAI SZEMLE / Statistical Review / 74:(3) pp. 230-238.
Zsarnóczai J.S., Zéman Z. (2019): Output value and productivity of agricultural industry in Central-East Europe. Agricultural Economics – Czech, 65: 185-193
WEF (World Economic Forum, 2018): Global Competitiveness Report, Index.
https://www.weforum.org/press/2019/10/the-10-trillion-question-why-has-global-productivity-stagnated-for-a-decade/
Global Competitiveness Index
http://reports.weforum.org/pdf/gci-2017-2018-scorecard/WEF_GCI_2017_2018_Scorecard_GCI.pdf
Vajda, Andrea
PhD Student, Szent István University, Faculty of Economics and Social Sciences, Ph.D. Doctoral School of Management and Business Administration
@ WCTC LTD --- ISSN 2398-9491 | Established in 2009 | Economics & Working Capital

