Comparison of the economic situation of Mongolia and some similar Asian countries
Abstract
The aim of the paper is comparing Mongolian economic growth with other Asian countries selected to learn from those countries’ best practices. There were studied Asian countries that are more dependent on Mining export and classified as lower-middle-income countries like Mongolia, i.e., Kyrgyzstan, Kazakhstan, and Indonesia in this research. Two dependent and 20 independent macroeconomic variables from 1991 to 2017 were used as variables, retrieved from the World Bank database. The analysis is executed via the SPSS and RExcel, which includes descriptive statistics and multi-dimensional scaling. According to multidimensional scaling results, the Indonesian economy is significantly different from other countries’ economies, while Kyrgyzstan’s economy is the most similar to the Mongolian economy. As for Mongolian and Kyrgyzstan economic growth, only 38.9% and 23.8% are explained by the given variables. Moreover, both countries’ economic growth is explained by different variables. Therefore, it is assumed that the Mongolian economy is unique and inappropriate to compare with other countries.
Keywords: Multidimensional scaling, GDP, economic growth
Introduction
Mongolia is a landlocked East Asian country that is bordered by the Russian Federation to the north and the People’s Republic of China on the east, west, and south. Mongolia is the 18th largest country in the world by area, and second-largest landlocked country behind Kazakhstan, which has a land area of 1,566,600 square kilometers. As for foreign trade, 85.1% of the total export went to China, followed by 11.6% to the United Kingdom, 4.8% to Switzerland, and 1.2% to the Russian Federation. Like export, the main importing countries were China 31.6% of the products and the Russian Federation 26.2%.
Many researchers examine a cross country economic comparison. For example; Demirgüç-Kunt & Levine, 2004; Jappelli, 2010; Jorgenson & Nishimizu, 1978; Hein, 1992; Dougherty, 1993); Ball, Michael, & Morrison, 1996. Participants and stakeholders include policy makers, investors, banks, internal management. Predicting the financial performance of companies accurately is crucial for a variety of stakeholders (Daniel, O et.al. 2020). However, there is not any published economic comparison with Mongolia by the researcher`s knowledge.
There are many Asian countries like Pakistan, India, Uzbekistan, Vietnam, etc. However, we chose the countries, which are more dependent on mining export and classified as lower-middle-income countries like Mongolia. Kazakhstan is an exception since Kazakhstan is classified as an upper-middle-income country, Kazakhstan is in a similar geographical area and possesses oil reserves and minerals. Kazakhstan is the world’s largest landlocked country, followed by Mongolia. By crude oil output and price increase, Kazakhstan jumped from lower-middle-income economies to upper-middle-income economies just within two decades.
The objectives of the study are the answers to the questions below:
- To examine the current economic status quo of Mongolia.
- To determine whether a significant difference exists among the countries’ economic growth variables.
- To determine which variables affect the most for each countries’ economic growth.
- To determine the comparable economy to the Mongolian economy.
The rest of this paper is organized as follows: Section two reviews the material and method which are used in this study. Section three consists of empirical results and discussion. Empirical study starts with the Mongolian economic status quo, followed by the comparison of chosen countries’ economic growth. Finally, conclusions are drawn in section four.
2. Material and Method
Firstly, this paper examines the Mongolian current economic character and economic status quo. As for the Mongolian economic situation, data are retrieved from Mongol Bank, National Statistics Office of Mongolia. In that part, the most crucial economic sectors are introduced. Afterward, Mongolian economic growth is compared with that of the other three Asian economies.
The database includes GDP growth, GDP per capita growth of four countries, representing economic growth, along with 20 macroeconomic variables with a duration of 26 years. Data were collected from the World Bank database, from 1991 to 2017. GDP does not measure many aspects of economic well-being, and there are serious conceptual and practical problems in measuring and comparing GDP across countries; however, GDP remains a rough-and-ready measure of standard of living (Weil, 2016).
The research methods used in this study were ANOVA, stepwise regression, analysis of variance, multidimensional scaling, and linear regression. The ANOVA test was used to determine whether a significant difference exists among the countries. Stepwise regression was used to choose the variables for further research. Contrarily, multidimensional scaling (MDS) is applied to determine the comparable economy to the Mongolian economy. MDS is a computational, statistical, and visualization technique that represents “similarity” between objects (Machado & Mata, 2015). RExcel is used throughout the research.
Results and Discussion
1 Mongolian current economic status quo
Mongolian economy relies heavily on mineral extraction, particularly in 2016, copper, coal, and gold, which constitute 32.7%, 19.8%, and 15.4% of export, respectively (NSO.mn, 2016). Mongolian economy faced an economic recession with regards to its dependency on the mining sector, from double-digit economic growth. Mongolian economic condition is considered to be affected by two factors. First, more than 90% of Mongolian exports consistently go to China (Figure 1). Therefore, any slowing of Chinese growth affects the Mongolian economy. Second, economic policies designed to protect Mongolia’s sovereign interests and to respond to the expectations of the Mongolian public have discouraged FDI (Foreign Direct Investment) (Brown, 2014).
Figure 1 Comparison of Mongolian total export and mining export
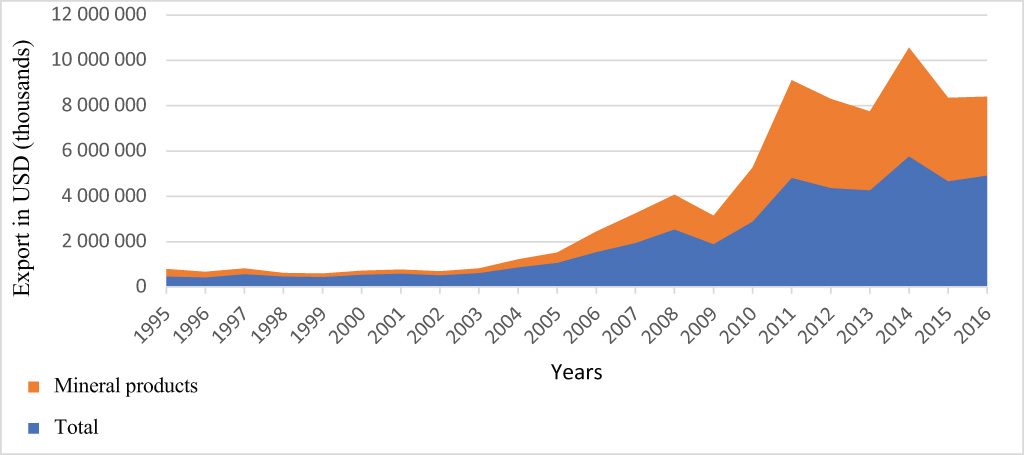
Source: own editing using Mongolian Statistical Information Service’s database
Figure 2 Comparison of total coal export and coal export to China
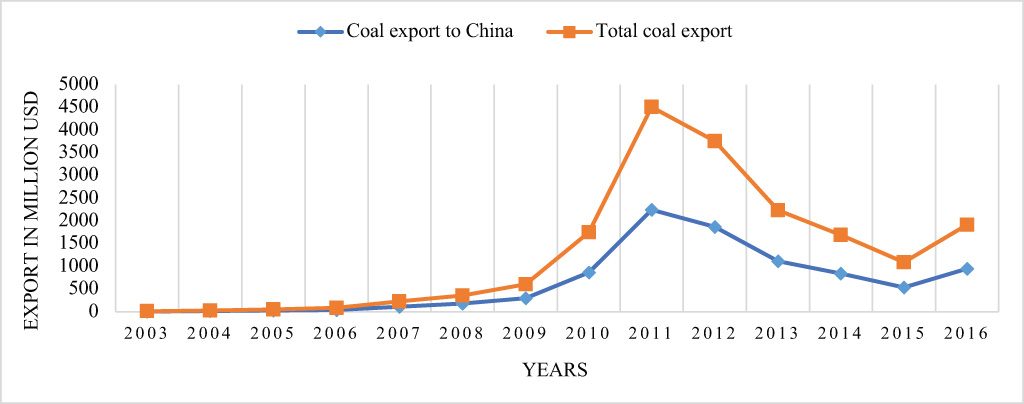
Source: own editing using Mongolian Statistical Information Service’s database
Figure 3 Employees by gender in the construction sector
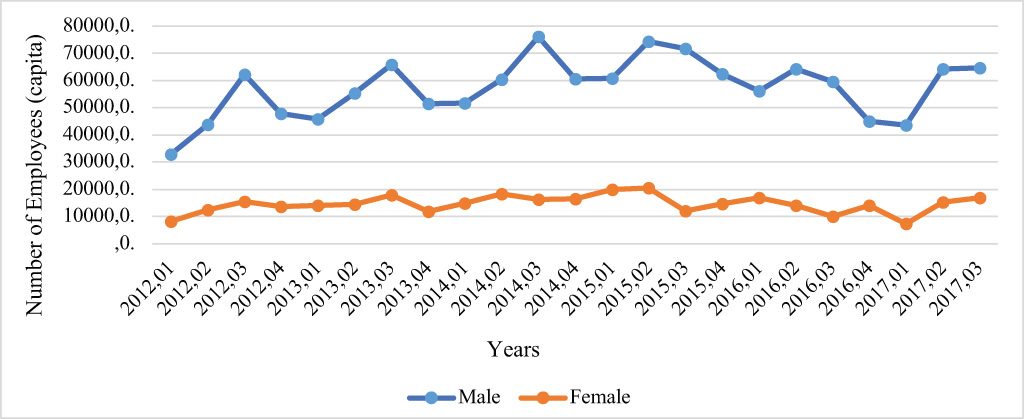
Source: own editing using Mongolian Statistical Information Service’s database
From 1995 to 2016, the amount of total export was 5,774.3 million USD, and the mining product’s export was 4,791.4 million USD in 2014, which was the highest, in Figure 1. The highest growth in total export (68.63%) was in 2011 when the export amount of mining products increased by 82.6%. Between 1995 and 2003, the amount of export was stable. However, from 2004 the amount of export increased gradually. Export amount boosted during 2007-2008, but export declined from 2,534.4 million USD until 1,885.3 million USD by 25.6% due to the economic recession in 2009. In 2010, the mining sector exports were 81.0% of total exports, and during 2011-2012 this figure rose to 89.2%.
The price of mineral exports, however, is anchored mainly by international market prices. Export to China and the total Mongolian export is illustrated in Figure 2. The biggest client for Mongolian coal export is China (Mongolia’s trade with China was about 97.6% in 2016). This lack of diversification has made the economy highly exposed to the ups and downs of China’s commodity demand (Li, Gupta, & Yu, 2017).
The agricultural sector plays an essential role in the Mongolian economy. It constitutes for 11.68% of the total GDP (2,796.1 million MNT) and employed 30.36% of the workforce (348,487 people) in 2016. Mongolian economy is traditionally based on agriculture and livestock. The number of livestock is about 19.72 times more than the population. However, the number of herdsmen is relatively small than the total population, which is 311,373 herdsmen (10% of the population). Livestock output in 2016 was 3.49 billion tugriks, which were determined by livestock’s rearing is 14.6% of GDP, 23.9 billion MNT (Mongolian tugrik).
The construction sector made up 3.96% of the GDP by earning 948.1 million MNT in 2016. Ulaanbaatar is the coldest capital city in the world with an average temperature -1.3 grads Celsius which poses a challenge to the construction sector. Most of the construction companies operate from April to October due to the harsh climate. The shortness of the business activity negatively affects materials delivery schedules and, more importantly, the labor force.
Female and male employees in the construction sector are illustrated in Figure 3 (from the first quarter of 2012 until the third quarter of 2017). Due to seasonal construction work, the number of female employees in the construction sector is relatively stable than male workers. Female workers are usually office employees in financial or managerial positions. Every first quarter the number of male employees is the lowest while every third quarter the number is highest. In the second quarter of 2015, the construction sector constituted 8.28% of the workforce, which was the highest during the given period. Seasonal business activity poses a challenge to the construction companies to find well-trained workers since the workers are not in the long term.
2 Comparison of Economic Growth
Economic growth is determined by two dependent variables and 20 independent variables. The ANOVA test is used for every variable to determine whether a significant difference exists among the countries ( 1).
Table 1 Economic growth and variables
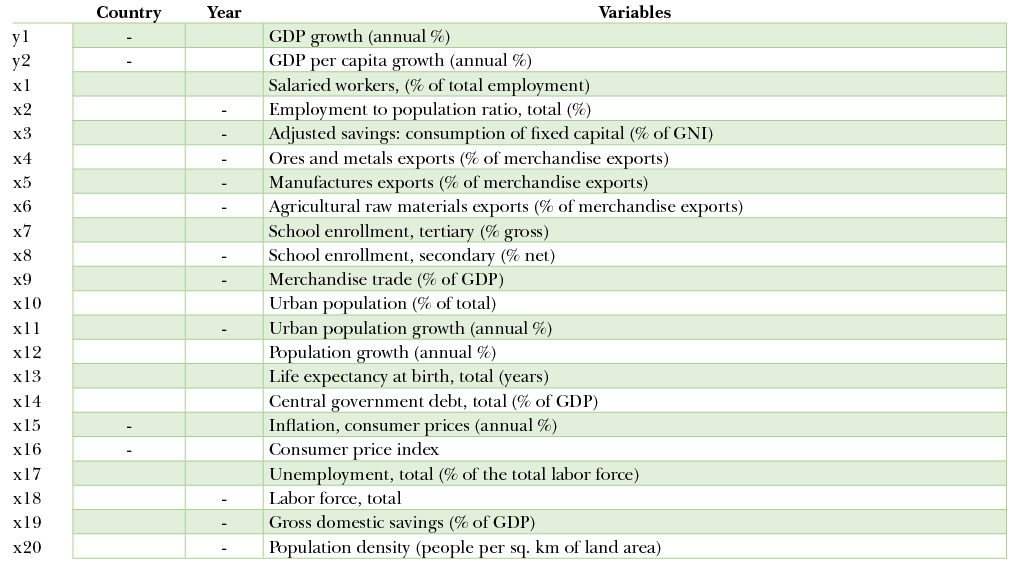
Source: Authors’ compilation
1 illustrates that the most independent variables are significantly different among countries, except inflation and consumer price index. A line marks insignificant differences in countries. On the contrary, none of the dependent variables are significantly different among the countries. Since significant differences occurred to most of the variables, stepwise regression is applied, Table 2.
Table 2 Stepwise regression results of GDP growth by countries
Source: Authors’ compilation
Consumer price index and employment to population ratios are significantly important ratios for all the four countries’ economic growth. Population density affects Kyrgyzstan negatively, and the urban population positively affects Kazakhstan’s economy, which is unique to the other countries.
Table 3 demonstrates which variables affect the most. Significantly important variables are given in the italic form. The consumer price index is significantly important for all four countries (at a 10% confidence level in Kyrgyzstan). Moreover, the urban population significantly affects economic growth except for Kyrgyzstan. As for Kazakhstan, population growth weighs more than half of the given variables.
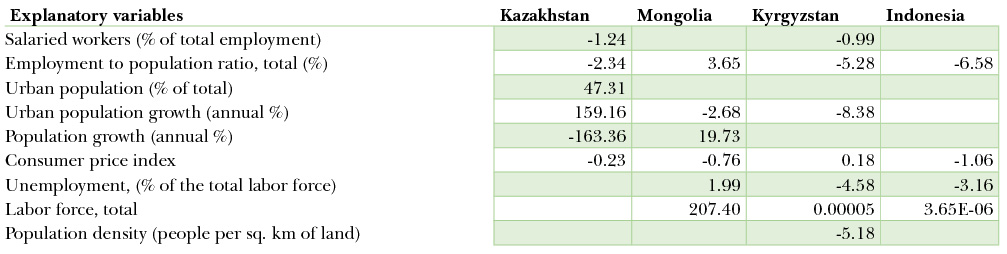
Table 3 Analysis of variance (by GDP growth)
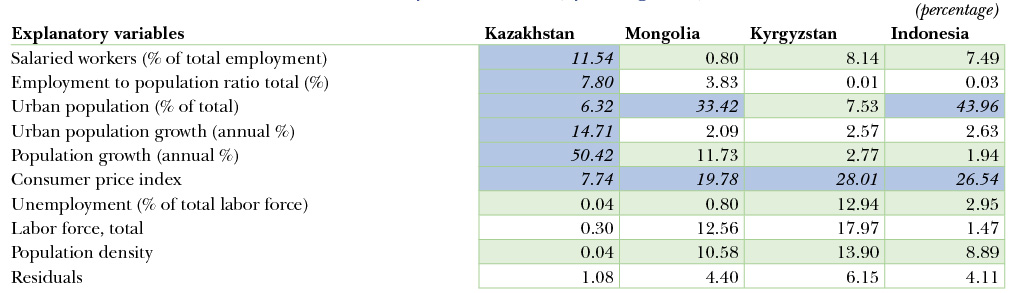
Source: Authors’ compilation
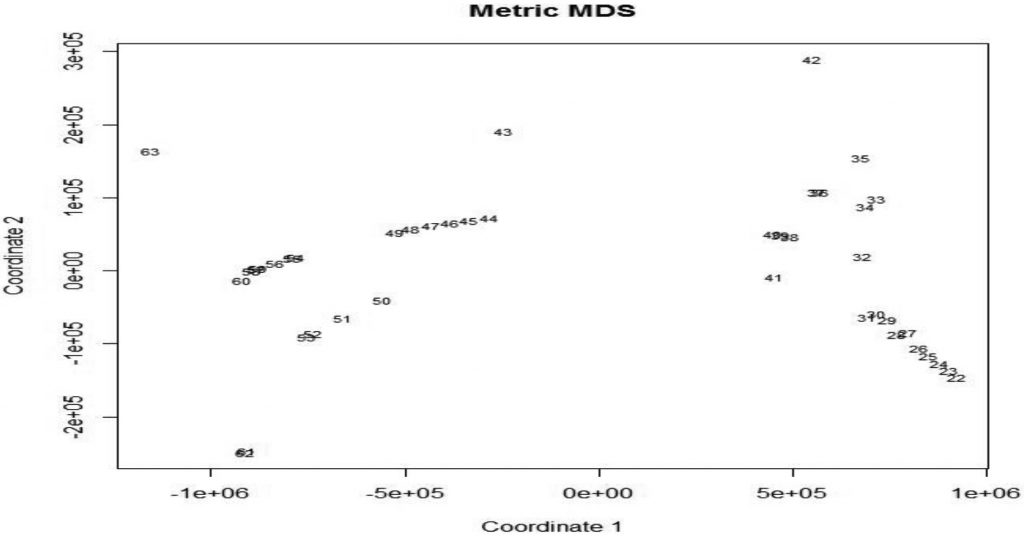
The multidimensional scaling is applied to determine the comparable economy to the Mongolia economy (Appendix 1). If all four countries are compared, the Indonesian economy is significantly different from other countries’ economies. Kyrgyzstan’s economy is the most similar to the Mongolian economy based on the variables given (Figure 4).
Figure 4 Multidimensional scaling
(Mongolia 22:42 and Kyrgyzstan 43:63)
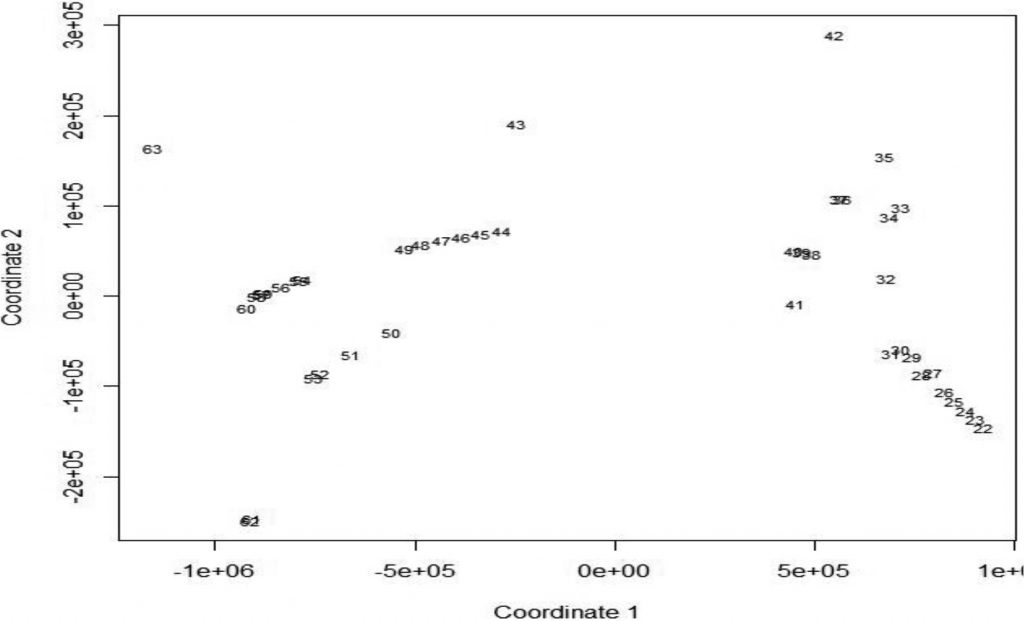
Source: Drawn by R statistical system
Although Kyrgyzstan’s economy is the closest by similarity, Mongolian economic growth and Kyrgyzstan’s economic growth are determined by different variables (Table 4). Linear regression is applied in the countries individually and determined significant independent variables for each country. It is noteworthy that different variables drive each country’s economy.
Table 4 Linear regression results of GDP growth
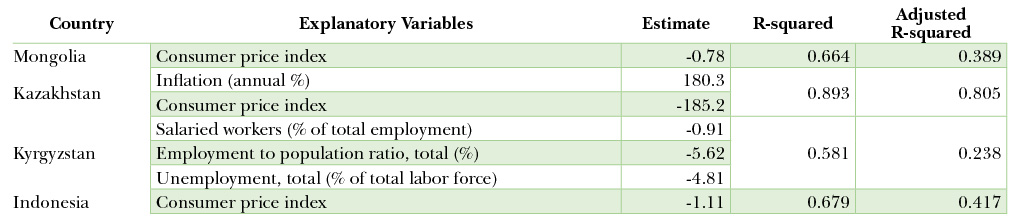
Source: Authors’ compilation
Consumer price index and inflation are commonly determined by economic growth except for Kyrgyzstan. Although inflation and consumer price index together determine 80.5% of the economic growth, there is high multicollinearity among the macroeconomic variables. As for Mongolian and Kyrgyzstan economic growth, only 38.9% and 23.8% are explained by the given variables. Moreover, both countries’ economic growth is explained by different variables. Therefore, it is assumed that the Mongolian economy is unique and inappropriate to be compared with other countries. In the thesis, only Mongolian companies’ financial performance is determined, and Mongolian three main sectors’ performance is compared to achieve reasonable conclusions.
Conclusion
This study consists of two parts of the research. On the one hand, the research introduces Mongolian current economic character by the most crucial economic sectors. On the other hand, Mongolian economic growth is compared with some Asian countries’ economic growth (i.e., Kazakhstan, Kyrgyzstan, and Indonesia). The economic comparison aims to learn from comparable countries’ best practices.
Mongol Bank and Mongolian Statistical Information Service’s database are used for the first part of this study, whereas the second part uses the macroeconomic variables, which cover 26 years from 1991 to 2017, obtained from the World Bank website. The criteria to choose the countries are to be dependent on Mining export economically and to be classified as lower-middle-income countries like Mongolia, except Kazakhstan. Although Kazakhstan is classified as an upper-middle-income country, Kazakhstan is in a similar geographical area and possesses oil reserves and minerals. Multidimensional scaling is applied via RExcel to determine the comparable economy to the Mongolia economy.
According to multidimensional scaling results, the Indonesian economy is significantly different from other countries’ economies, while Kyrgyzstan’s economy is the most similar to the Mongolian economy. As for Mongolian and Kyrgyzstan economic growth, only 38.9% and 23.8% are explained by the given variables. Moreover, both countries’ economic growth is explained by different variables. Therefore, it is assumed that the Mongolian economy is unique and inappropriate to compare with that of other countries. Therefore, it is not appropriate to compare Mongolian companies with foreign companies from different economic situations. Companies are compared to their sectors and sizes.
References
Ball, M., & Morrison, T. A. W. (1996). Structures investment and economic growth: a long-term international comparison. Urban Studies, 33.
Brown, C., & Coleman, T. (2014). Department of State: 2014 Investment Climate Statement. U.S. Department of State, 17. https://doi.org/10.1017/CBO9781107415324.004
Daniel, O., & Richard, N., & Peter, G., & Zéman Z. (2020). Corporate Bankruptcy Prediction Model, a Special Focus on Listed Companies in Kenya. JOURNAL OF RISK AND FINANCIAL MANAGEMENT (1911-8066 1911-8074): 13 3 pp 1-14 (2020)
Demirgüç-Kunt, A., & Levine, R. (Eds. (2004). Financial structure and economic growth: A cross-country comparison of banks, markets, and development. MIT press.
Dougherty, J. C. I. (1993). A comparison of productivity and economic growth in the G-7 countries.
Hein, S. (1992). Trade strategy and the dependency hypothesis: A comparison of policy, foreign investment, and economic growth in Latin America and East Asia. Economic Development and Cultural Change, 40(495–521).
Jappelli, T. (2010). Economic literacy: An international comparison. The Economic Journal, (120(548), 429–451).
Jorgenson, D. W., & Nishimizu, M. (1978). US and Japanese economic growth, 1952-1974: an international comparison. The Economic Journal, (88(352)), 707–726.
Li, B. G., Gupta, P., & Yu, J. (2017). From natural resource boom to sustainable economic growth: Lessons from Mongolia. International Economics, 151(March), 7–25. https://doi.org/10.1016/j.inteco.2017.03.001
Machado, J. A. T., & Mata, M. E. (2015). Analysis of world economic variables using multidimensional scaling. PLoS ONE, 10(3). https://doi.org/10.1371/journal.pone.0121277
Mapsofworld.com. (2016). Mongolia Map, Map of Mongolia. Retrieved November 24, 2019, from https://www.mapsofworld.com/mongolia/
NSO.mn. (2016). Mongolian Statistical Information Service. Retrieved January 1, 2020, from http://1212.mn/Stat.aspx?LIST_ID=976_L05&type=tables
Weil, D. N. (2016). Economic Growth : International Edition
Retrieved from http://eds.a.ebscohost.com/eds/ebookviewer/ebook/bmxlYmtfXzEyNDQyMTJfX0FO0?sid=30c10635-1da0-45e7-b478-da53dfa8b7fa@sdc-v-sessmgr01&vid=2&format=EB
Batchimeg Bayaraa
University of Debrecen, Ihrig Károly Doctoral School
of Management and Business
Tibor Tarnóczi, Veronika Fenyves
University of Debrecen, Faculty of Economics and Business
Appendixes
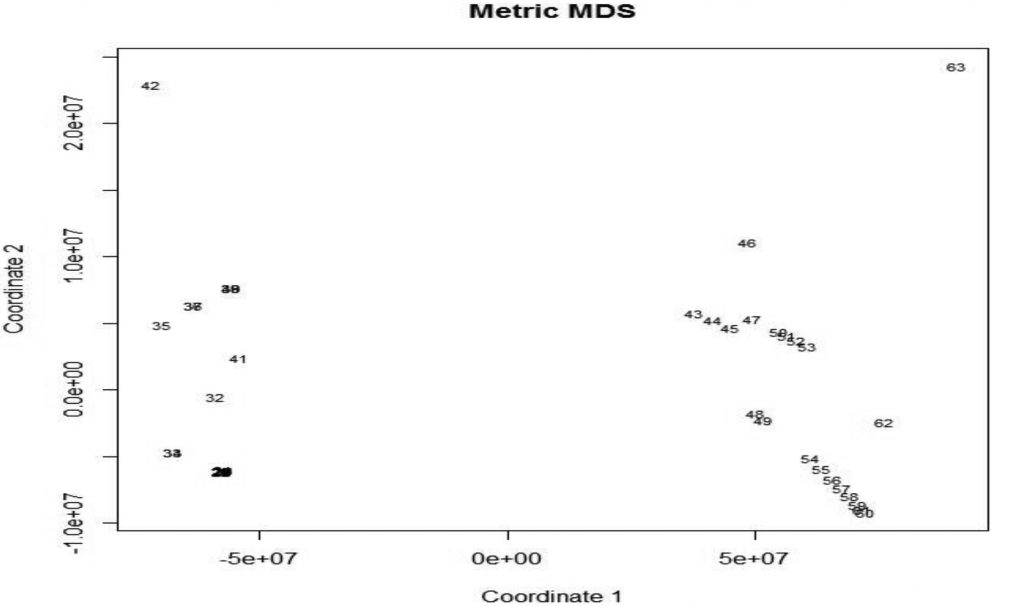
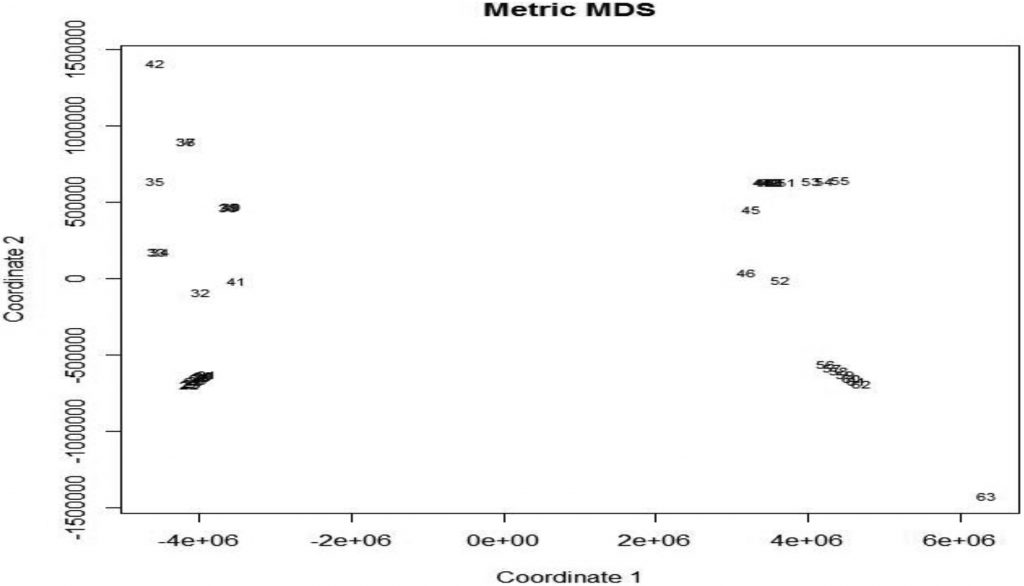
1. Multidimensional scaling
(Mongolia 22:42 and Kyrgyzstan 43:63)
2. Multidimensional scaling
(Mongolia 22:42 and Indonesia 64:84)
3. Multidimensional scaling
(Mongolia 22:42 and Kazakhstan 1:21)

@ WCTC LTD --- ISSN 2398-9491 | Established in 2009 | Economics & Working Capital