Development of a classification methodology for financial and accounting indicators, case study
Abstract
In the 21st century, different IT and digitization systems are creating the opportunity for contorlling for efficient and accurate performance evaluation. Although information from Big Data and various other data-driven systems can be effective, reporting based on financial metrics and reporting is very popular for most businesses. However, in many cases, reporting is difficult because the system can become too complex for non-standardized processes of an individual project nature. For controlling, the management of this complexity lies in the application of various models that can be implemented primarily in the field of mathematics. Different aggregation and extrapolation methods provide an opportunity for contorlling to handle complexity and non-standardized processes. In my research, I illustrated a contorlling system through a case study that is capable of managing complexity and evaluating the performance of a firm through financial-accounting indicators at different hierarchical levels. As a result of the research, a set of models and methods will be presented, which, regardless of the industry, will enable companies to effectively assess their performance.
Introduction
Today, change in global supply chains is an inevitable factor that affects the core operations of almost every industry, business and organization. The network of supply chains has become increasingly extensive as a result of globalization. However, the coronavirus and the Ukrainian-Russian conflict have highlighted the very high exposure of these networks and the consequent disadvantages. As a result, the process of insourcing has become increasingly important in recent years. In addition to insourcing, there is another trend that is changing the role of each manufacturing and service activity in the supply chain. Although modern technology creates the maximization of mass production efficiency, there are many raw materials, products, semi-finished products, and services that cannot be effectively standardized. Such activities represent high added value. However, in global supply chains, these project-based, custom manufacturing companies, which are primarily players in supply chains with a Western European control center, are becoming increasingly important in Central and Eastern Europe.
One such industry or activity is the manufacture and assembly of industrial parts. In most cases, the production and assembly of industrial parts is a special, project-based activity in which each order represents a separate project. Controlling systems and ERP systems, on the other hand, must fit into this system in such a way as to be able to evaluate the performance of different projects (Tabesh, et al., 2019). in a form that also fits the five basic purposes of contorlling. In practical life, organizations can do this either in an island-like form or in an integrated form. (Peral, et al., 2017Sch). For both forms, the indicators based on the report and the reports derived from it can be an appropriate starting point. (Otley, 1999)
In the research, I will illustrate a complex controlling system based on financial and accounting indicators, which allows performance evaluation in individual projects and subjective areas. The aim of the research is to represent the general nature of the excavation, thus creating an opportunity for companies operating in various other fields. Financial-accounting indicators appear through various report tables creating opportunities for standardized coverage. Financial KPIs are a universal part of modern contorlling systems that allow large data sets to be used for the contorlling system. (Hazen, et al., 2014) Properly defining and structuring KPIs between strategic goals and data sets can be an effective solution. (Fanning 2016) Prior to the Big Data era, KPIs played an important role in management control systems (Antony – Govindarajan, 2006), but perhaps the greatest emphasis has now been placed on KPI management in the field of strategic controlling tools. (Sharifi et al., 2016). A KPI is an indicator that illustrates how effectively an organization or function is working toward its goals. There are KPIs formulated at higher levels and defined at higher levels, and aggregation of KPIs can be used to explore and implement the logical relationships between them. (Antony – Govindarajan, 2006) KPI aggregation is a set of methodologies based on mathematical-statistical and logical correlations (Duru et al., 2013). (Bayou – Korvin, 2008) KPI aggregation allows controllers to express performance in a single indicator, thus facilitating decision-making. (Schnellbach – Reinhart, 2015)
Thus, in my research, I will illustrate a performance-based KPI-based system, through a unique case study, that allows firms to evaluate the performance of a complex system with high subjectivity using financial-accounting metrics.
Methodology
In our research, we performed an instrumental case study. Our case study served an industrial small and medium-sized enterprise in Pest County. We chose the instrumental case analysis method to discover the shortcomings of the existing theories and the methods used in practice. The model used in practice is examined on the basis of the methods formulated in the theoretical literature and the results of other empirical research. (Babbie, 2013). The main activity of the examined organization is the production and assembly of individual components, which is carried out under modern production technology conditions. The company had 135 employees at the time of the case study, which includes the company’s management. The subjects of the semi-structured in-depth interview research were the organization’s financial and accounting staff, who described the organization’s controlling system and reporting activities during the research. The aim was to examine the controlling system of the company included in the case study and the classification method for performance evaluation of the results of the indicators analyzed by the controlling system.
Results
The controlling system of the company is based on two main pillars. One of the main pillars is the annual report and the annual statements based on its detailed analysis, while the other is the process-related KPI evaluation report table. The company monitors the different separate activities in each case and stores the results of the evaluation in an information system. This information system is a custom-developed database in which data recording is possible along various parameters. In addition, a production control and scheduling system operates in an island-like manner, from which reporting is also possible. It is important to emphasize that the company evaluates the evaluation and analysis of the processes related to this production at the operational level and they are not part of the controlling measurement system. The applied controlling system is a standardized complex system based on plan-fact analysis. Report tables are created based on the data accounts uploaded to the database. These report tables contain a number of KPIs that can be considered as standard metrics in each case. This creates the possibility of comparability. The causal relationships between the KPIs in the report tables and the valuation thresholds, as well as the method of calculating the KPIs, are determined in a standardized manner by management in each case. KPIs, different calculation methods and thresholds should be in line with the corporate strategy defined by the board.
In all cases, the target values of the statements based on the report are in line with the strategy. The organization does not set targets for the report. It sets objectives to be achieved for the statements based on the accounts.
The controlling system, as shown in Figure 1, forms a multi-level hierarchical system. One of the main elements of this system is the report table shown in Figure. This KPI report table uses a number of data. The necessary data are provided by the results of the activities. Consequently, the first of the hierarchical levels is provided by process-related data. It is important to emphasize that in the case of processes, a number of data are measured, a significant part of which covers technical parameters. In most cases, these technical parameters and results are not necessarily entered into the system manually, but are automatically recorded by data processing programs of various production lines and automated warehousing systems. This data is basically not collected by the controlling system, but is used as a database if necessary.
Figure 1: Reporting levels of controlling activity

Source: Own Editing
The financial accounting department is responsible for preparing the controlling reports. Following the preparation of the report tables, the detailed evaluation of the tables and the determination of their relevance is the responsibility of the economic management.
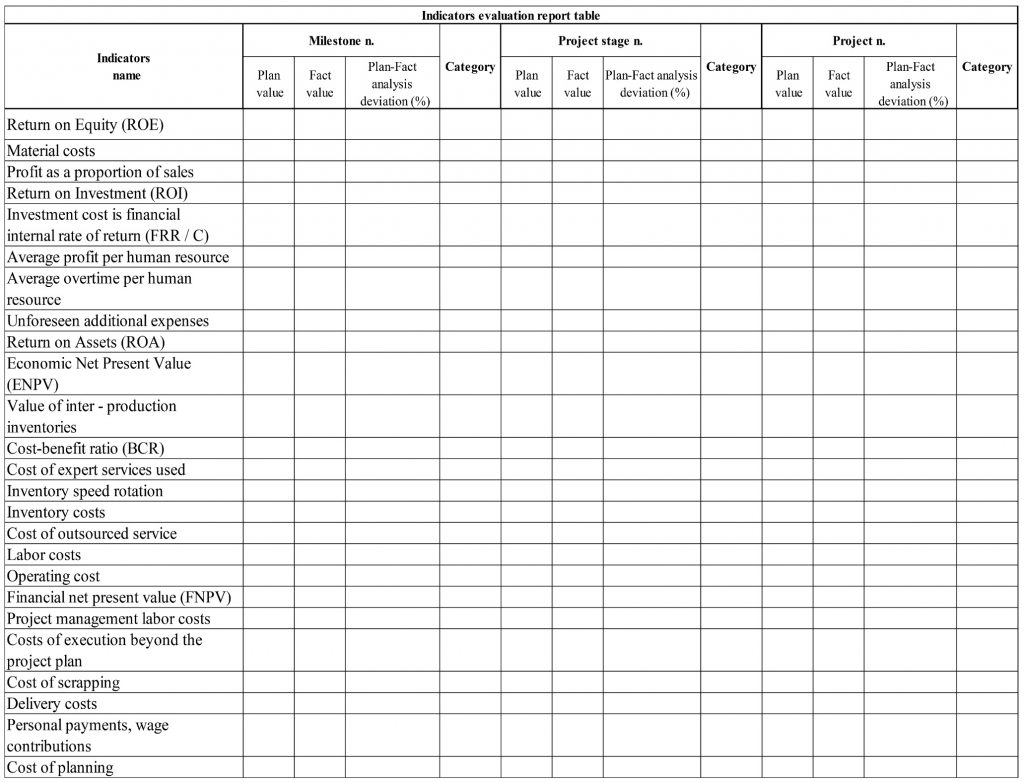
The reporting table used (Table 2) is similar to the accounting clearing structure, focusing mainly on expenses and income. Although the double-entry logic is not included, the KPIs used and the data used are in significant agreement with the accounting analyzes used. One of the most important criteria in the KPI Analysis Report Table (Table 1) is the financial and cost aspect. This means that it is mandatory to assign a value in financial units to each indicator. According to the economic management of the enterprise, the ultimate unit of measurement for each process and activity must be the currency. This is why process-level reports are only generated and evaluated at the operational level. In each case, the KPIs formulated in the various reports must relate to a specific area and have a significant amount of information.
In business planning and plan-fact analysis, the company uses a top-down planning method. It follows that the task of economic management is very emphatic, as they need to know and estimate the level of expected performance to approximate reality. An inappropriate target can greatly skew the final assessment. The results of the predefined KPIs are the basis for evaluating the reports. Each indicator has a plan-fact analysis that can be used to identify intervention points. The values of the indicators are measured periodically, and the actual results of the actual data are used to make a forecast for the closing of the given period and the performance of the activity. The forecast is based on the plan-fact analysis ratio for the indicators. During the reporting activity, the reasons for the discrepancies and the intervention options for the discrepancies are summarized based on the KPI tables. The preparation of the summary report for the period is the responsibility of the financial accounting department, but the evaluation and the formulation of possible intervention action plans are the responsibility of the economic management. The report compiled in this way is evaluated by the board of directors and the economic management, during which the intervention steps that can lead to the successful implementation of the organizational strategic goals are voted on.
Performance evaluation process of indicators
The organization has a predefined set of rules for evaluating differences in plan-fact analysis. Based on the system of rules, the indicators evaluate the differences determined on the basis of plan-fact analysis according to different categories. During the evaluation, it should be emphasized that a negative deviation of revenues compared to the pre-defined target values means non-fulfillment of the target value of the indicator, while a positive deviation from the target values of costs means non-fulfillment of the target value of the indicator.
The company basically defines three different classes against which KPIs and each indicator are judged. This allows controllers to effectively evaluate and monitor. In the case of some indicators, typically the classification of cost-expressing indicators, the additive inverse of the value of the indicator is evaluated.
1. Underperformance:
This category includes any KPI that falls short of the expected goals set for the KPI. If a KPI falls into this category, there will be an immediate review by management to explore and resolve the issue. As the controlling system does not reveal clear correlations, correlations therefore require individual and subjective exploration to determine the causes and areas that result in review. The company classifies the extrapolated plan-fact analysis ratios in the underperformance category if the value of the deviation deviates negatively by more than 5% from the target value.
2. Adequate performance
This category includes KPIs whose expected actual values reach the target value. There is no need to explore a causal relationship for these KPIs. Properly performing KPIs are a kind of expected performance. KPIs are included in the appropriate performance category if the deviation from the target value in both negative and positive directions is a maximum of 5%. It can be seen that there is a tolerance of five per cent in the direction of both overperformance and underperformance. This discrepancy is due to the general inaccuracy of the design.
3. Outperforming
For the overperformance category, the targets set by the company are expected to be exceeded by the actual values. In this case, the given KPI or aggregate receives a kind of excellent evaluation, so the value of the positive deviation of the indicator from the target value during the evaluation is greater than 5%.
During its operation, the organization shall define an additional category that refers to significant overruns of the pre-defined KPIs. The name of the category is Extra Outperforming.
4. Extremely outperforming
The KPI value significantly exceeds the target associated with the period under review. The difference between the extrapolated actual value and the predefined design value in the positive direction exceeds 15%. This category provides feedback on the formulation of the target value, assuming under-planning in its definition. Under-planning has a negative effect on the efficiency of the organization, as it incorrectly determines the level of capacity utilization in the financial year.
Controlling statements are created manually using a spreadsheet program. These reports are mainly compiled at the end of the marketing year, but there are also individual cases for which different periods are defined within the marketing year for which these reporting tables are prepared. These report tables are always calculated cumulatively for the specific periods and sections of the different activities. This creates an analysis and evaluation system in which the results of a given period or stage can be evaluated on their own. When evaluating the cumulated results, it is possible to evaluate the performance of the processes in a given period, as well as the predictive evaluation calculated from this. After preparing the report tables, the business management evaluates these data tables in detail. Interventions identify intervention points and look for causal relationships for effective intervention. The organization uses linear extrapolation for financial KPIs, which enables effective decision-making and timely response through predictive analysis. Predictive analysis also provides an opportunity for the various expected results to be predictive of both the report and the annual results.
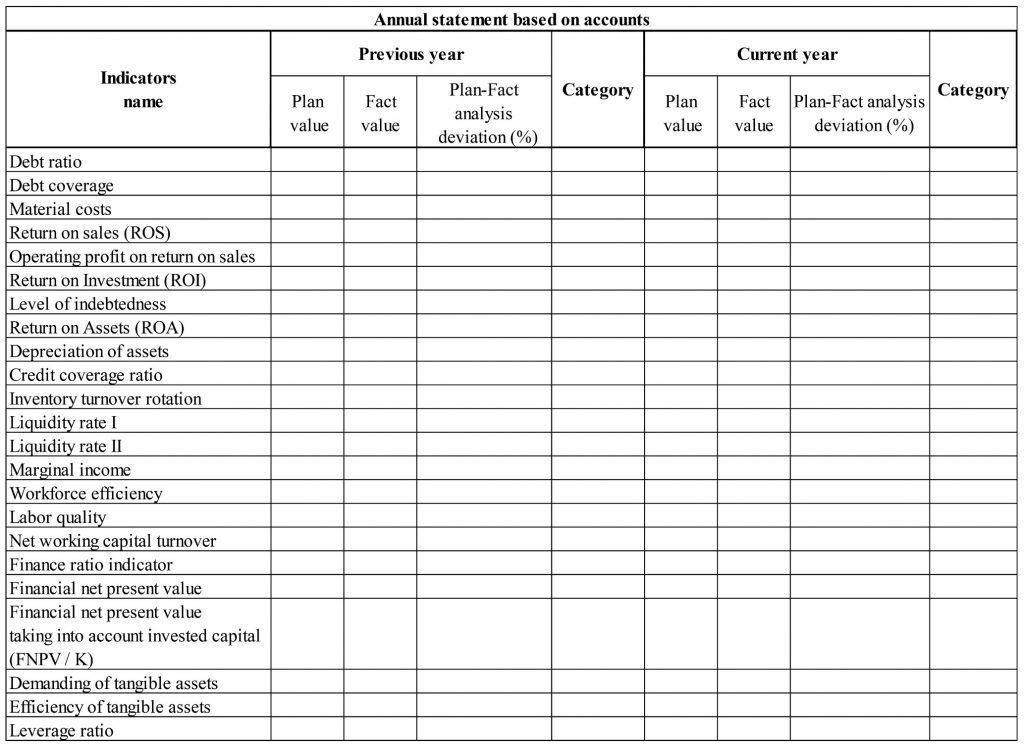
In all cases, the valuation at the company level is based on the reports based on the report. This assessment shall in all cases relate to the financial year in question. The report and the various statements are primarily annual reporting activities to the Board of Directors. The performance assessment is based on the assessment of the financial indicators in Table 2 and these reports cover the entire financial year and the selected periods. The report tables contain KPIs and information that are not directly included in the report, and the report also includes metrics that are not included in the report tables. However, the results of the report tables have a clearly demonstrable effect on the financial statements and the statements derived from them, but the exact causal relationships have not been explored in detail in the company so far. Due to this diversity, the report and the statements derived from it are compiled on the basis of general ledgers, while the report tables are compiled primarily from databases linked to processes.
Conclusions
The main advantage of the applied controlling system is the effective monitoring of financial performance. The complex system that the organization uses allows it to effectively analyze various processes and activities using financial metrics. It is also important to highlight the standardized system along which the evaluation process can become more comparable and thus more accurate. Linear extrapolation facilitates the assessment of expected performance in the light of trends and thus facilitates the exploration of intervention points. The use of the analysis of the financial statements and the statements based on the financial statements as the highest level of the hierarchy makes it possible to overcome the difficulty of analyzing and evaluating the financial year and the performance of related functions at the company level.
The disadvantages are the low level of exploration of the correlations between the report tables and the report and the consequent lack of a dynamic evaluation system. This needs to be explored later, so that the controlling system can provide even more accurate feedback on performance. There are a number of risks involved in manually capturing data, and increasing the level of automation can make data capture more efficient. The goal orientation of the different functional areas and the exploration of more precise and deeper intervention points can be marked as shortcomings. To explore these deeper levels of intervention, the process monitoring system should also be integrated into the controlling system and operated as a single system. The statements based on the financial statements do not always reflect the strategic objectives and can therefore only be used to assess the financial results of the financial year. In the event that the strategic goal differs from the financial performance, the controlling system is not suitable for effective monitoring. The controlling system should be able to identify strategic intervention points accurately and based on appropriate data. However, currently the controlling system focuses on assessing the financial performance of the financial year. This data is used primarily to make decisions and evaluate the performance of the company.
Supported by the ÚNKP-21-3-II New National Excellence Program of the Ministry for Innovation and Technology from the Source of the National Research, Development and Innovation Fund.
Table 1: KPI evaluation report table
Source: Own Editing
Table 2: Annual statement based on accounts
Source: Own Editing
REFERENCES
Anthony, R. – Govidarajan, V. (2006): Management Control Systems, McGraw Hill, McGraw-Hill Education; 12 edition ISBN: 0073100897
Duru,O. – Bulut, E. – Huang, S. – Yoshida, S. (2013): Shipping Performance Assessment and the Role of Key Performance Indicators (KPIs): ‚Quality Function Deployment’ for Transforming Shipowner’s Expectation. SSRN Electronic Journal, pp. 1-18
Fanning, K. (2016): Big Data and KPIs: A Valuable Connection 2016., Corporate Accounting and FinanceVolume 27, Issue 3, pp. 17-19
Hazen, B. T. – Boone, C. A. – Ezel, J. D. – Jones, Farmer, L. A. (2014): Data quality for data science, predictive analytics, and big data in supply chain management: An introduction to the problem and suggestions for research and applications. International Journal of Production Economics, Issue 154, pp. 72-80.
M. E., Korvin A. (2008): Measuring the leanness of manufacturing systems—A case study of Ford Motor Company and General Motors. J. Eng. Technol. Manage. Vol. 25 pp. 287–304
Otley, D. (1999): Performance management: a framework for management control systems research. Management Accounting Research, 10(4), pp. 363-382.
Peral, J. – Maté, A. – Marco, M. (2017): Application of Data Mining techniques to identify relevant Key Performance Indicators. Computer Standards & Interfaces, 2(54), pp. 76-85.
Schnellbach, P. – Reinhart, G. (2015): Evaluating the Effects of Energy Productivity Measures on Lean Production Key Performance Indicators. Procedia CIRP, Issue 26, pp. 492-497.
Sharifi, S. – Shirouyehzad, H. – Nasr Esfahani, A. (2016): Identifying and prioritising of KPIs based on BSC by multi-criteria decision making – the case of the Central Post Office of Isfahan, International Journal of Productivity and Quality Management. Vol. 19, Issue 4 pp. 423-445.
Tabesh, P. – Moushavidim, E. – Hasani, S. (2019): Implementing big data strategies: A managerial perspective. Business Horizons, 3(62), pp. 347-358.
Gergő Thalmeiner, PhD. student
Hungarian University of Agriculture and Life Sciences, Institute of Rural Development and Sustainable Economy
Sándor Gáspár, Assistant professor
Hungarian University of Agriculture and Life Sciences, Institute of Rural Development and Sustainable Economy
Prof. Dr. Zoltán Zéman, Professor
Hungarian University of Agriculture and Life Sciences, Institute of Rural Development and Sustainable Economy

@ WCTC LTD --- ISSN 2398-9491 | Established in 2009 | Economics & Working Capital