Significance and possibilities of measuring intellectual capital based on accounting statements
Abstract
Intellectual capital is the difference between the market and book value of companies, the measurement possibilities of which have been dealt with by many; however, no unified standpoint has emerged so far. Currently, its value does not appear in the accounting statements because the book value presented at enterprises is tangible, and the value of intellectual capital is difficult to quantify. In our paper, we present the significance and possibilities of measuring intellectual capital through the example of two companies, using Baruch Lev’s intangible capital calculation.
Introduction
In our time, it is becoming more widely known that knowledge and information are among the highest values (Amrik et al., 2018). Since the ultimate financial purpose of businesses is to create value, assessment of the value of companies becoming more and more important in business life, together with the factors which constitute and promote the creation of added value. However, it may be a question whether tangible assets of companies are decisive regarding value creation, or elements like intangible assets should be sought.
It can be observed that the market and book value of companies are different, and the gap between them is steadily growing. It is assumed that there must be a capital that allows this difference is considering this. In the literature, this value has been referred to as intellectual capital, which is the most considerable portion of corporate value at more and more companies. The importance of the intellectual capital is may be surprising at first sight, but considering the rapid changes in our world, it is not that shocking at all. Our world changes fast, and under current circumstances, only companies that can keep up with changes and development can remain prosperous and gain a lasting competitive advantage. It is becoming increasingly important for companies to respond to changes in time and to be able to adapt to the increasing competition. This adaptation can only be achieved if they possess sufficient information about their environment and their internal activities and if they improve their organizational knowledge through the transformation of this data into knowledge. It can be said that intellectual capital has contributed significantly to the successes – and at the same time the failures – of the past decades taking the above into account. Recently the role of the intellectual capital is becoming very important inside small and medium enterprises, the main reason is that of their influence in the formulation and implementation of strategies in these enterprises (Rexhepi et al., 2013). We seek answers to the following questions through the concept of intellectual capital, covering the possibilities of its measurement:
- What do we mean by intellectual capital?
- To what extent is it measurable and tangible?
- When a company is evaluated, and its assets are taken into account, where does this highly valuable corporate value appear or does it appear at all?
The question arises: what sort of value do intangible goods represent to enterprises besides tangible goods due to market competition and the development of corporate environment? What value do human knowledge, corporate culture, skills, and abilities represent? These factors are indispensable for the efficient operation of the company.
Definition of intellectual capital
Assets that are not classifiable as any category of tangibles and contribute to increasing the value of a company are called intangibles. As synonyms of these assets, we may also find the term of intellectual capital (Juhász, 2004). Under intellectual capital, Wiederhold (2014) means intangible factors that are involved in the creation of value, which is practically convertible into value. Currently, the majority of products originates from intangible assets, and only a smaller proportion is derivable from tangible assets. If such products are sold in large quantities, high income is accompanied by low production costs. Additional value beyond the cost of production is the result of people and their knowledge, using which added value is created (Wiederhold, 2014). According to Jónás et al. (2011), intellectual capital as an available resource should be observed from the aspect of the organization of the company; that is, not the measured data are the most important, but the perceived values that are associated to each measured value by the organization. According to Al-Ali (2003), intellectual capital means intangible resources and assets, which are utilized for value creation by organizations through their conversion to new services, products, and processes. In business, intangible assets and tangible resources have always been recorded when they produced value for the company. However, earlier these elements accounted for a smaller share of the total resources of the company, but in the information and knowledge-based economy, this proportion is steadily increasing, and currently, intangible assets represent the majority. Examining the market capitalization of companies, it is perceptible that companies have a higher market value than book value, which is not a new phenomenon, but there are more substantial differences within the knowledge-based economy (Betbulls, 2015). Book value usually shows the value of the tangible and capital assets of the company. Sometimes, some intangibles appear amongst the intangible assets, but this does not exactly reflect the real value of intangibles of the company. Market value shows the hidden value recognized by the market; such as reputation, the innovative ability of the company, knowledge of employees, but even the added value of corporate culture (Al-Ali, 2003).
The difference between market value and book value is attributed to intellectual capital, which might possess very serious value for businesses. Intellectual capital is often identified with intellectual property rights by many, which is a misguided approach because it does not cover every intangible asset. Intellectual property is a part of the intellectual capital that can be owned, such as a patent or a trademark (Wiederhold, 2014). One of the features of intellectual capital is that it can be recorded in such cases as patents, but at the same time, it may be flexible as the ability and knowledge of people. Another feature that it can be input and output of a value-creating process at the same time because intellectual capital can be considered as knowledge converted into value or as the final product of knowledge transformation (Dzinkowski, 2000).
Elements of intellectual capital
The Skandia measurement system well demonstrates what constitutes the market value of a company and gives us an insight into the elements of intellectual capital. Numerous research has dealt with the examination of intellectual capital (Benevene, 2017; Pedro et al., 2018). Figure 1 shows that market value consists of financial capital and intellectual capital, which can be divided into two main parts: human capital and structural capital. The value of structural capital is attributed to customer capital and organizational capital (Edvinsson, 1997). The three main elements are human capital, which holds together the knowledge and abilities of employees; customer capital, which represents the network of customers, suppliers, and distributors; and organizational capital, which includes organizational structure, culture, and processes (Al-Ali, 2003).
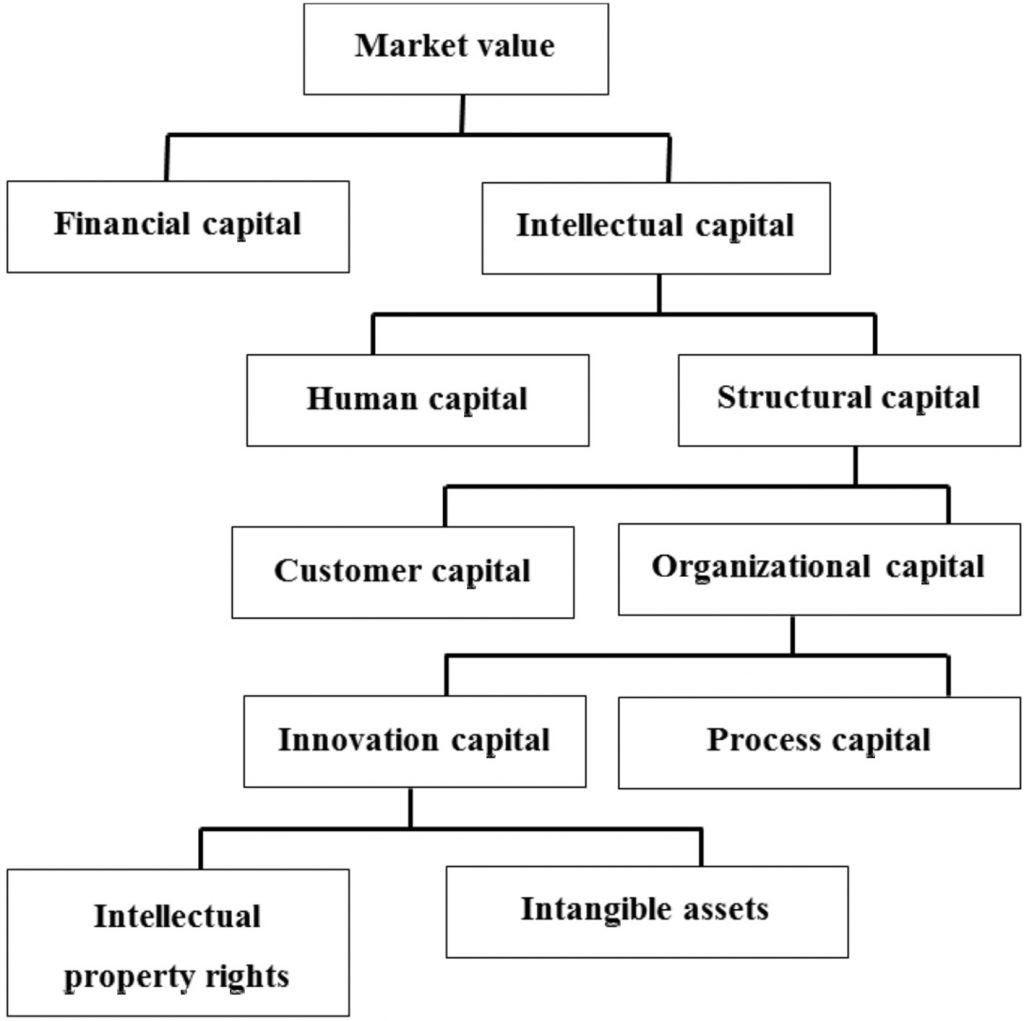
Figure 1: Capital structure of companies
Source: Edvinsson, 1997
It can be said about human capital – contrary to organizational and contact capital – that technical literature is mostly in agreement with its concept and it is a category of capital. Researchers classify human knowledge, expertise, know-how category of knowledge, abilities, and skills into human capital (Klausz, 2006).
The increased significance of human capital has become apparent over the recent period, and it can be observed that the proportion of employees carrying out intellectual work is much higher than that of employees doing physical labor in the scope of actual production. This is also borne out by the fact that while in 1995 the share of employees in the service sector did not reach 30%, ten years later it rose above 60% (Keeley, 2007).
Structural capital is interpreted differently by some authors. In the approach of Stewart, Edvinsson and Malone structural capital is interpreted only at the organizational level. In the classification shown in Figure 1, customer capital and organizational capital are jointly treated as structural capital (Tóth, 2010). Contrary to human capital, structural capital may be retained even if the workforce changes. The value of customer capital or network capital indicates the value of the relationship with clients. The customer base includes information acquired about customers by the organization, such as the expectations of customers towards each service or product. Not only customers are important; the relationship with suppliers and distributors also affects the level of customer capital (Wall et al., 2004). According to Mohácsi (2016), networking capital – although created by members of the organization – is long-lasting and becomes independent from actual persons. Organizational capital is a value that remains with the company even after the employees went home. This includes patents, intellectual property rights, routine procedures that form the capital part of the process, which is characteristic of the company and contributes to better performance. This includes the added value of software, databases, information technology systems, and corporate culture (Boda, 2005; Wall et al., 2004).
Measurement possibilities of intellectual capital
By measuring intellectual capital, it is possible to take into account how added value is generated during the production of products and to come to know the value of intangible assets (Wiederhold, 2014). Measurement and management of intellectual capital is an increasingly important part within the long-term successfulness of the company (van den Berg, 2003). Traditional corporate valuation methods build upon revenue and cash flows, forgetting about the decisive role of intellectual capital (Berzkalne – Zelgalve, 2014).
Maximizing corporate value has to be the primary goal of company executives (Berzkalne – Zelgalve, 2014); to achieve this objective, managers and investors need to know corporate intellectual capital as well, which has become a major value-creating tool of our time. According to Turner and Jackson-Cox (2002), there are three main reasons for measuring intellectual capital. On the one hand, companies invest considerable capital in the development of their employees, including the improvement of their knowledge. On the other hand, knowing the value of intellectual capital might be helpful in managing this, as it helps identify the companies that are consequently growing or decreasing thereby helping investors to see the market better. Third, getting to know the return on intellectual investment. If company management is aware of the long-term prospects of this area, resource allocation may become more efficient (Juhász, 2004). Measurement might be important due to the motivation of the company to learn, as this may make certain costs visible and possibilities for value creation may become easier to explore (Sveiby, 2001).
The most crucial problem with measuring intellectual capital is that usually we can only rely on indexes that are far from the analysed subject, which might result in the opposed position of the promises of the measurement method developers, the expectations of company managers, and the phenomena actually measured by the system (Sveiby, 2001). According to the technical literature, there are shortcomings in the accounting evaluation of intangible assets. Most regulations take into account market valuations only; therefore if the company itself creates knowledge or added value, it is not possible to recognize it. An intangible asset may be displayed on the balance sheet if it can be separated from goodwill if the company can influence the asset itself and the associated cash flows or if its cost is well measurable. However, most of these conditions do not apply to intellectual capital (Juhász, 2004). Limitations of financial statements regarding defining the value of the company underline the fact that currently not the manufacture of products and material goods, but the creation of intellectual capital is to be considered the source of economic value (Berzkalne-Zelgalve, 2014). The accounting system does not provide enough information to determine the value of such a company that predominantly possesses intangible assets (van den Berg, 2003). A particular way of measuring the intellectual capital is the ranking of the different universities done by special research institutions or journals based on several evaluation criteria (Kômíves-Dajnoki, 2015).
Introduction of intellectual capital measurement methods
Measurement of intellectual capital can be divided into two large groups: scorecard methods (Skandia Navigator, Balanced Score Card, VCI [Value Creation Index]) and financial methods. The first group takes into account all the “components” constituting intellectual capital and characterizes them with appropriate indexes. The second group measures intellectual capital on an organizational level and based on financial aspects (Luthy, 1998). The group of financial evaluation can be further divided into three more categories:
- Direct Methods: They attempt to estimate the monetary value of intellectual capital by identifying its components (TVC [Total Value Creation]).
- Return-based methods: These methods investigate the return of assets invested in intellectual capital and determine their value as a function of return (EVA [Economic Value Added], MVA [Market Value Added], CIV [Calculated Intangible Value], VAIC [Value Added Intellectual Coefficient], Baruch-Lev’s knowledge capital valuation).
- Market Value Based Methods: Its book value reduces market capitalization of the company, and the difference will be the value of intellectual capital (Tobin Q ratio, Stewart’s intellectual capital) (Sveiby, 2001; Luthy, 1998).
Baruch lev’s knowledge capital valuation method
According to Baruch Lev, the physical assets of a company alone do not generate value, so all surplus is linked to intellectual capital. This finding needs to be clarified by accepting these assets easily acquirable from the market, mass-produced and standardized (Juhász, 2004). The basis for this approach is that physical, financial and intellectual assets essentially provide the performance of companies, and these assets generate revenue in the future as well. Measurement methods generally do not deal with the future value creation of intellectual capital, so Lev’s method aspires to pay attention to this as well. It deducts the income of physical and financial assets from the financial gains of the company, which results in the income generated by intellectual capital. Assuming that this financial result will continue to appear in the future, intangible capital can be estimated. According to Lev, the function determining the economic performance of companies is the following
|
Economic performance = |
Within the formula, α, β and γ represent the contribution of a unit of the given assets to corporate performance. For measuring corporate performance, Lev suggests the average of past and future results. Future earnings can be estimated based on sales estimates or based on the forecasts of financial analysts. In general, the income of the past and the next 3-5 years is taken into account, so normalized income will be a weighted average of 6 to 10 years, with future revenue being more weighted. The second step is to determine the value of the three asset groups. Financial and physical assets can easily be determined from the company’s balance sheet. The value of the third asset group is obtained by estimating the rate of return of physical and financial assets (α and β) and then multiplying them by the value of the related assets, which results in their contribution to the income that is deducted from the profit of the company. The remaining part represents the contribution of intangible assets, which divided by the expected yield rate results in the intangible capital (Figure 2).
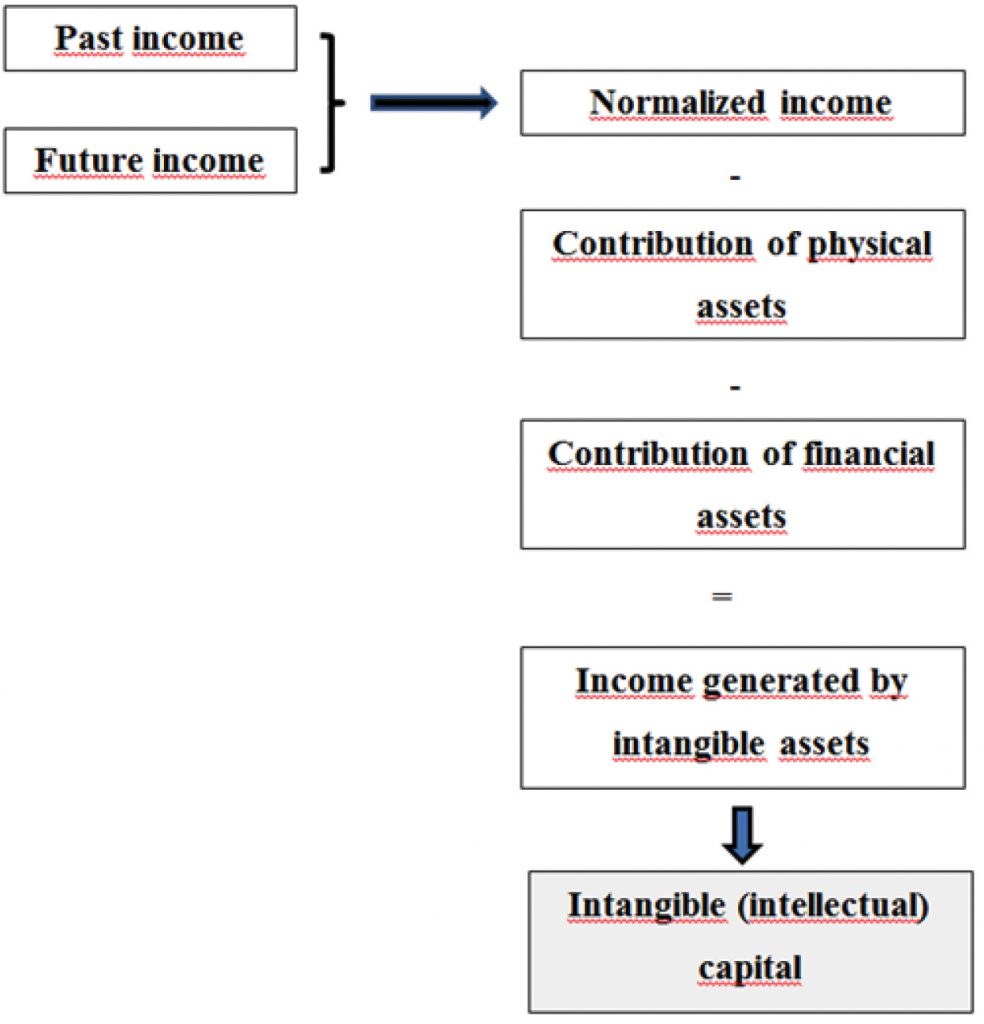
Figure 2: The process of determining intangible capital according to Baruch Lev
Source: Own editing based on Gu-Lev (2003)
In the scope of his research activities, Lev concluded that corporate profitability estimates are less accurate when approached from the aspect of material and financial assets than utilizing intellectual capital to measure it. An additional advantage of this method might be that it can distinguish under- and overpricing of shares (Gu-Lev, 2003).
Calculation of baruch-lev’s knowledge capital valuation in practice
ANY Biztonsági Nyomda (ANY Security Printing House) Plc. and Kulcs-Soft Plc. stock exchange companies have been selected for the study. When selecting them, it was our objective to involve companies from different industrial sectors, where the presence of intellectual capital associated with their activity is presumable. We used publicly available documents to collect the information required for calculation and applying the methods.
Equity and market value of ANY Biztonsági Nyomda Plc. are different, the market value is higher than the amount represented on the balance sheet. Except for the year 2012, the market value of equity is higher than all the liabilities of the company, which means that it is presumable that the company possesses intellectual capital (Figure 3).
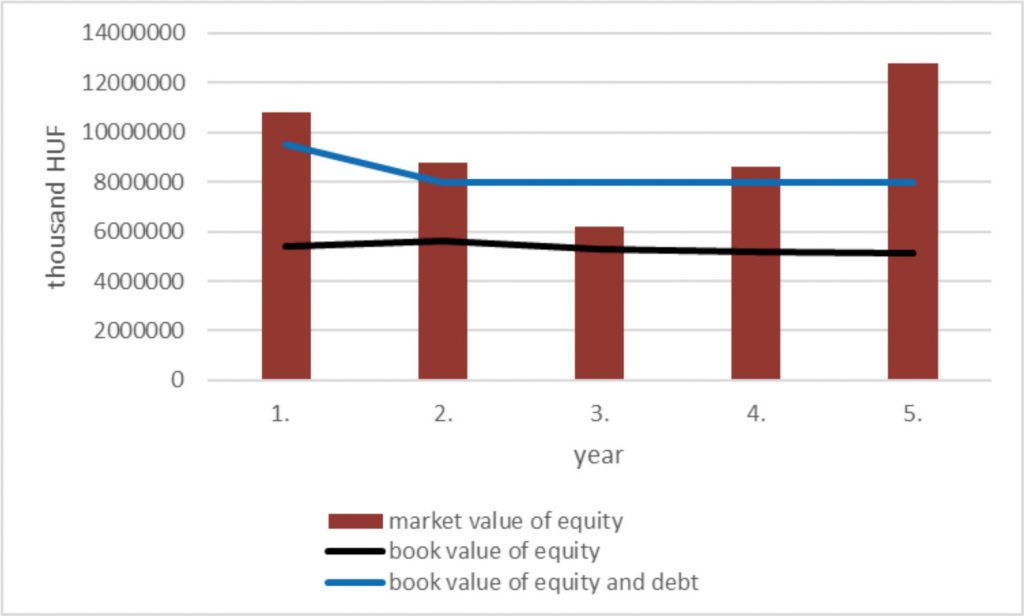
Figure 3: Equity of ANY Plc.
Source: Own editing based on annual financial statements and own calculations
The presence of intellectual capital is also assumable in the case of Kulcs-Soft Plc., as the market value of equity is much higher than the book value of both the equity and all corporate capital (Figure 4).
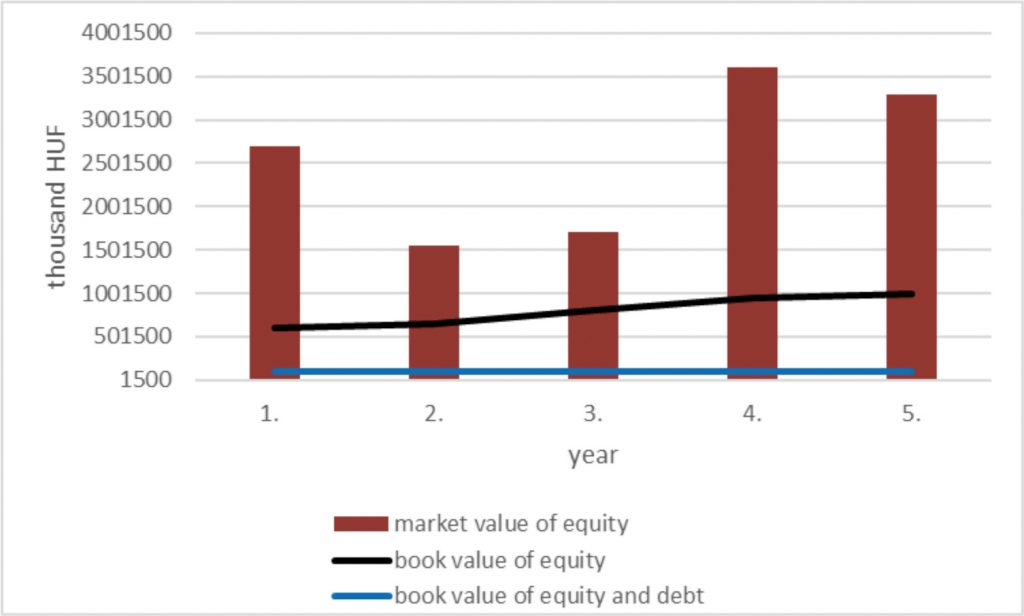
Figure 4: Equity of Kulcs-Soft Plc.
Source: Own editing based on annual financial statements and own calculations
Based on Figures 4-5, it can be laid down that the same is true for the investigated companies, namely the market values are higher than their book value, and that surplus must have some underlying content, therefore the presence of intellectual capital in companies is likely.
The value of intellectual capital according to Lev’s method was determined using Monte Carlo simulation, which is an analytical method that calculates model input values by generating random numbers, and utilizes them to operate the model; the results can be used for the evaluation of the model (Pokorádi-Molnár, 2010). The method for determining the value of intellectual capital is based on the economic performance measured by income. To calculate the so-called normalized income, we had the after-tax results of the last five years, and we estimated them for the next five years.
Value of intellectual capital – Kulcs-Soft Plc.
In the model, the estimation of after-tax profit expects an annual increase of 2%. For estimating future data, we calculate with a 2.5% average long-term inflation. The normalized income for the current year was determined as the average of the normalized income increased by inflation for the previous year and the income for the year under review. Since Lev’s model has to consider future data with a larger weight, a one and a half times larger weight was utilized. As the input of the model, it is also required to determine the normalized value of tangible and invested financial assets. The standard deviation was determined as 15%. The expected return on tangible assets was 9-12%, and a 6-9% interval was determined for the invested financial assets.
Using the data, we executed the simulation in the R statistical system, where 5000 model calculations have been carried out for a better approximation to reality.
The results of the simulation (mean, median, 95% confidence interval) were also calculated for both asset groups and the income (see Table 1)
Table 1: Random Number Generation – Kulcs-Soft Plc.
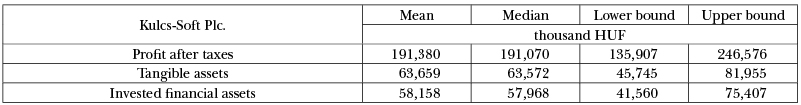
Source: Own editing based on simulation
It is clear that in all three special cases, there are minimal differences between the mean and median values, which means that the results do not differ significantly from a normal distribution (see Table 2).
Table 2: Development of expected earnings – Kulcs-Soft Plc.
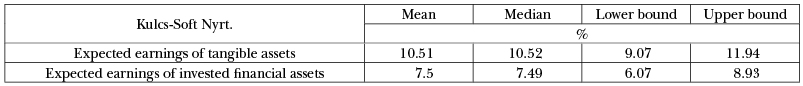
Source: Own editing based on simulation
Table 3: Excepted earnings of intellectual capital – Kulcs-Soft Plc.
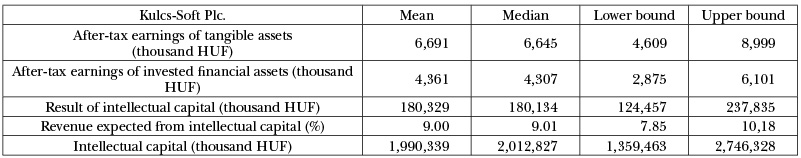
Source: Own editing based on simulation
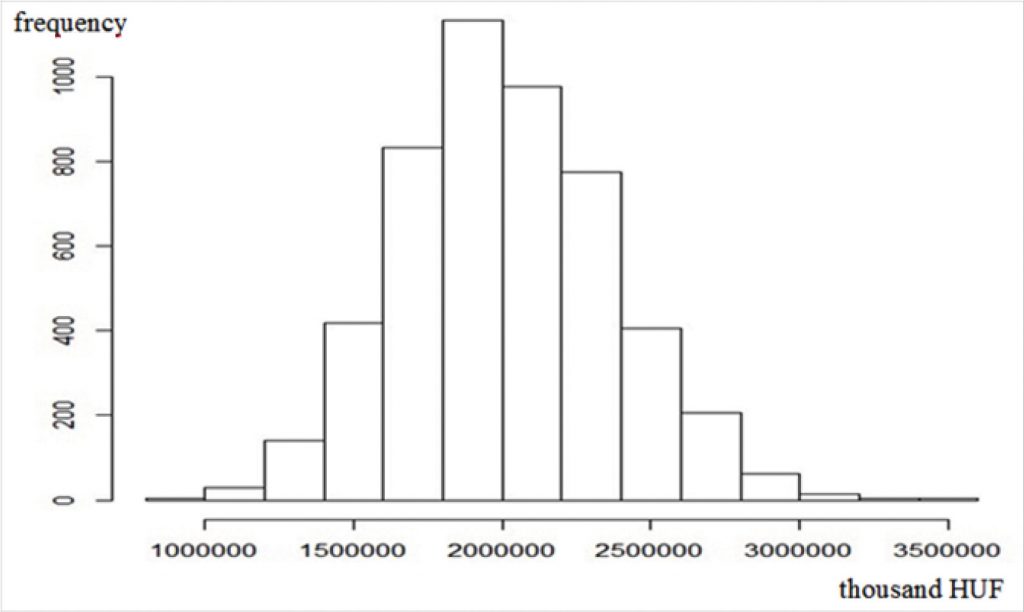
Figure 5: Distribution of intellectual capital –
Kulcs-Soft Plc.
Source: Own editing based on simulation
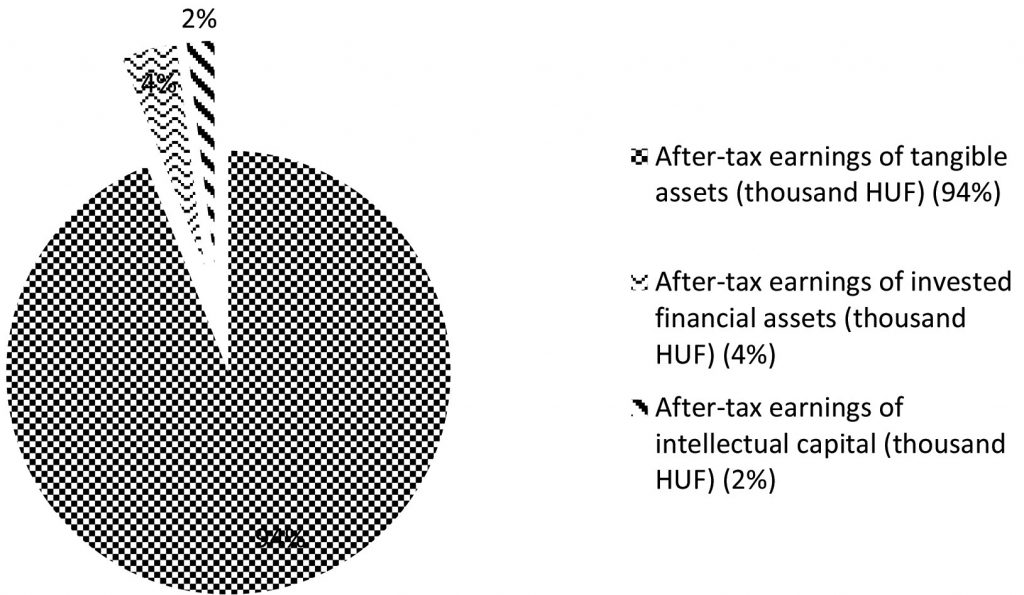
Figure 6: Proportion of after-tax profit of different capital values – Kulcs-Soft Plc.
Source: Own editing based on simulation
Further calculations were performed with the obtained values. Multiplying the expected earnings rate of tangible assets by the value of tangible assets, we get the after-tax profit of tangible assets. After-tax earnings of invested financial assets can be determined the same way. The after-tax earnings of intellectual capital are equal to the profit after taxation minus the two previously calculated income types (see Table 3). As the expected earnings of intellectual capital, we have taken the mean value of the other two expected earnings, which can be used to determine the value of intellectual capital as the quotient of the result generated by it and its expected earnings.
Value of intellectual capital is very high compared to tangible assets and invested financial assets.
After-tax earnings of tangible assets (6,691 thousand HUF) represents 4% of total after-tax profit. After-tax earnings of invested financial assets (4,361 thousand HUF) represents only 2% of total after-tax profit.
Intellectual capital contributes to the after-tax profit in the highest proportion, by 94% (see Figure 6). In case we take into account the value of the above groups – and not their contribution to the after-tax result – we still get a similar result. Intellectual capital here also accounts for 94%, while the remaining 6% is equally divided between tangible and financial assets.
Value of intellectual capital – Any Biztonsági Nyomda Plc.
Although the two companies operate in somewhat different fields, to make it easier to compare the obtained results, we have taken into account similar conditions in the case of this company as for Kulcs-Soft Plc. The expected earnings derived from the random number generation of tangible assets and invested assets are presented (see Table 4).
Table 4: Development of expected earnings – ANY Biztonsági Nyomda Nyrt.
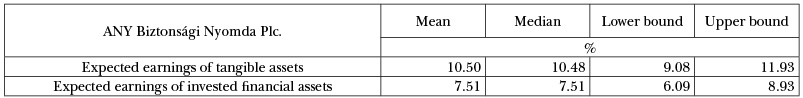
Source: Own editing based on simulation
The results of the simulation of expected earnings of tangible assets and invested financial assets were also calculated (see Table 5)
Table 5: Result of random number generation – ANY Biztonsági Nyomda Plc.
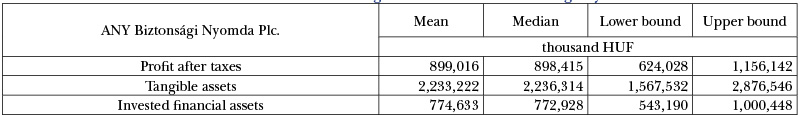
Source: Own editing based on simulation
The process of calculation was the same for ANY Biztonsági Nyomda Plc. as in the case of Kulcs-Soft Plc. (see Table 6).
Table 6: Expected earnings of intellectual capital – ANY Biztonsági Nyomda Plc.
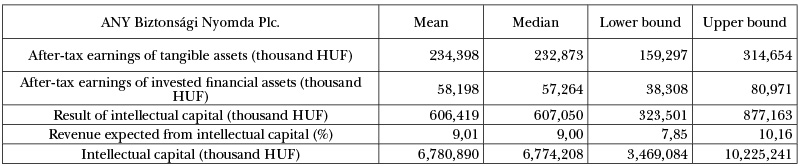
Source: Own editing based on simulation
The most frequent value is 6 774 208 thousand HUF, and the sums are mostly within the confidence interval (see Figure 7).
In the case of the distribution of after-tax profit, invested financial assets contribute at the lowest extent (7%) to the value of the company (see Figure 8). Tangible assets are at the second place with 26%. Intellectual capital contributed the largest proportion to the after-tax profit with 67%. Obviously, similar proportions are found if the value itself is taken into consideration, with the difference that the invested financial assets amount to 8% and the tangible assets to 23%. Thus, intellectual capital amounts to 69% amongst the assets, based on this method.
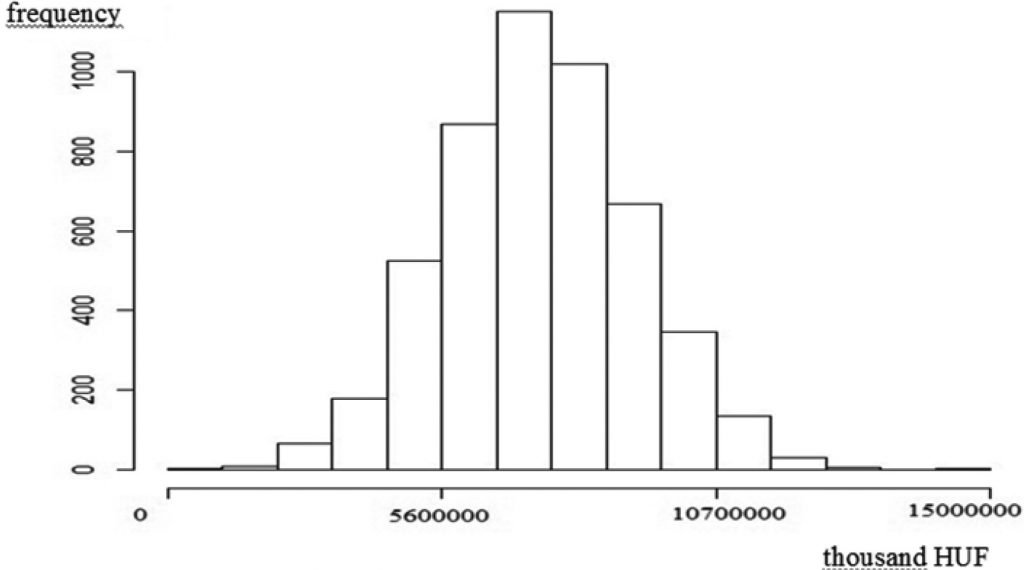
Figure 7: Distribution of intellectual capital – ANY Biztonsági Nyomda Plc.
Source: Own editing based on simulation
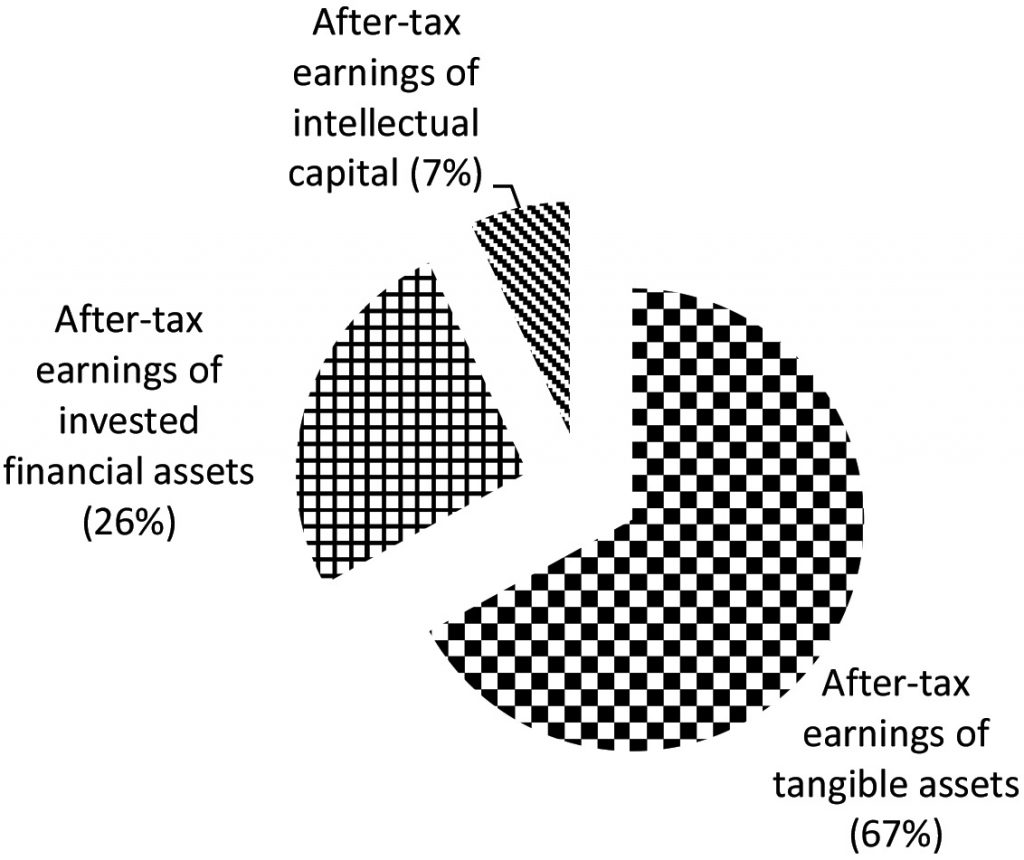
Figure 8: Proportion of after-tax profit of different capital values – ANY Biztonsági Nyomda Plc.
Source: Own editing based on simulation
Summary
It is observable that the market value of companies differs from their book value. In 2000, Baruch Lev examined the market value/book value ratio of the shares within the S&P500 index found a value above 5 in the average of 500 shares, which also underpins the difference between market value and book value. From this result, it can be seen that in average, only one-fifth of the market value is demonstrated by accounting in the analyzed year and the greater part of the market value is not accounted for (Baruch-Daum, 2004). We investigated how general this value is, how the index developed in recent years, how decisive is the value discussed reported by Lev (http://comstockfunds.com/(X(1)S(oq4jin24ggzn3w45k4lm1i55))/files/NLPP00000/030s.pdf)
The value of the index was the highest in 1999-2000. However, it showed a significant fluctuation between 1979 and 2016. From 1.2 in 1982, the index exceeded five by 2000 and then declined again and except for the period between 2009 and 2013 it has been above 2.4; the average of the period between 2000 and 2016 was 2.75 (http://www.multpl.com/sp-500-price-to-book).
It can be stated that regarding its tendency for the difference between market and book value of shares has increased. Although this ratio is not as high as the value published in the Lev study, it is still a question, how this difference can be explained? According to the majority of researchers, the difference between market and book value is due to the human factor (human resources), customer capital, and network capital. However, some authors attribute a significant role to research and development, growth or even strategy. It seems that all of the factors listed above jointly contribute to the growth of corporate value with a smaller or bigger weight.
Veronika Fenyves
Associate professor, University of Debrecen, Faculty of Economics and Business, Institute of Accounting and Finance
Zoltán Bács
Professor, University of Debrecen, Faculty of Economics and Business, Institute of Accounting and Finance
Laurenţiu Droj
associate professor, The University of Oradea, Faculty of Economics, Department of Finance and Accounting
Tibor Tarnóczi
associate professor, University of Debrecen, Faculty of Economics and Business, Institute of Accounting and Finance
References
Al-Ali, N. (2003): Comprehensive intellectual capital management.Step by step.John Wiley &Sons Inc, Hoboken, New Jersey
Amrik J. – Hittig G.G. – Gál Zs. – Bárczi J. – Zéman Z. (2018): Investing in the Future CIVIL REVIEW: ECONOMIC AND SOCIAL JOURNAL 2018:(14) pp. 140-164. (2018)
Benevene P. – Kong E. – Barbieri B. – Lucchesi M. – Cortini M. (2017) “Representation of intellectual capital’s components amongst Italian social enterprises”, Journal of Intellectual Capital, Vol. 18 Issue: 3, pp.564-587, https://doi.org/10.1108/JIC-12-2016-0127
Berzkalne, I. – Zelgalve, E. (2014): Intellectual capital and company value. Procedia Social and Behavioral Sciences, 110.sz. 887-896.o.
BetBulls (2015): Financial ratios. http://betbulls.hu/index.php/tozsdei-alapok/fundamentalis-elemzes/piaci-mutatok/ letöltés dátuma: 2015.06.20.
Boda, Gy. (2005): Development of knowledge capital and its impact on corporate management. Foundation for Information Society, Budapest
Dzinkowski, R. (2000), ‘The measurement and management of intellectual capital: an introduction’, Management Accounting, 78. évf., 2.sz., 32–36.o.
Edvinsson, L. (1997): Developing intellectual capital at Skandia, Long Range Planning, 30.évf., 3.sz., 366-373. o.
Gu, F. – Lev, B. (2003): INTANGIBLE ASSETS Measurement, Drivers, Usefulness. Working paper, Boston University School of Management Accounting, Boston
Juhász, P. (2004): Evaluation problems of intellectual capital, Loan-bank review vol. 3 issue 5, p. 59-82
Keeley, B. (2007): Human Capital. How what you know shapes your life. OECD Insights, http://www.oecd-ilibrary.org/education/human-capital_9789264029095-en – download date: 12/06/2015
Klausz, M. (2006): Intellectual capital as an under-utilized potential. Scientific proceedings, issue 14-15, p, 165-175
Kômíves, P. M. – Dajnoki, K. (2015): Ranking systems as the connection between the higher education and the labor market in Hungary. Procedia Economics and Finance 32 (2015) pp. 292-297.
Jónás T. – Dombi J. – Tóth Zs. E. (2011) Separation of the measurement and assessment of intellectual capital using evaluative functions. Management science Vezetéstudomány / Budapest Management Review, 42 (5). pp. 16-30.
Lev, B. – Daum, J.H. (2004): The dominance of intangible assets: consequences for enterprise management and corporate reporting. Measuring Business Excellence, Vol. 8., Num. 1. pp. 6-17.
Luthy, D. H. (1998): Intellectual capital and its measurement. Asian Pacific Interdisciplinary Research in Accounting (APIRA) Conference, Osaka, http://www.apira2013.org/past/ apira1998/archives/pdfs/25.pdf letöltés dátuma: 2015.09.25.
Mohácsi M. (2016): Relation of intellectual capital and business entities TAYLOR: Journal of economic and organizational science, 2016. (vol. 8) issue 1. (22) p. 101-109
Pedro E. – Leitão J. – Alves H. (2018) “Intellectual capital and performance: Taxonomy of components and multi-dimensional analysis axes”, Journal of Intellectual Capital, Vol. 19 Issue: 2, pp.407-452, https://doi.org/10.1108/JIC-11-2016-0118
Rexhepia G. – Ibraimi S. – Veseli N: (2013): Role of intellectual capital in creating enterprise strategy Procedia – Social and Behavioral Sciences 75. pp. 44 – 51. https://doi.org/10.1016/j.sbspro.2013.04.006
Sveiby, K.-E. (2001): Measuring Models for Intangible Assets and Intellectual Capital http://www.sveiby.com/articles/IntangibleMethods.htm download date: 25/09/2015
Tóth, B. I. (2010): Connections of intangible and territorial assets (Az immateriális és a területi tôke összefüggései). Space and Society (Tér és Társadalom), vol. 24 issue 1, p. 65-81
van den Berg, H. A. (2003): Models of Intellectual Capital Valuation: A Comparative Evaluation. The 6th World Congress on the management of intellectual capital, McMaster University, Hamilton, Canada
Wall, A. – Kirk, R. – Martin, G. (2004): Intellectual Capital? Measuring the Immeasurable. Elsevier Ltd.
Wiederhold, G, (2014): Valuing Intellectual Capital, Multinational and Taxhavens. Springer, New York
http://comstockfunds.com/(X(1)S(oq4jin24ggzn3w45k4lm1i55))/files/NLPP00000/030s.pdf
http://www.multpl.com/s-p-500-price-to-book

@ WCTC LTD --- ISSN 2398-9491 | Established in 2009 | Economics & Working Capital