Correlation of economic conditions for some economies in Africa, Asia with China
Abstract
The study analyses economic conditions with employment issue of selected economies, which represent some important different developed one in the developing economic countries, some of them are closed to EU, Turkey is sub-member state of EU, and some crude oil exporting economies, for example Saudi Arabia, Iran, Indonesia and Nigeria, and two leading economies of the world economy, namely China and Japan in this selected countries’ group. The selected countries are consisting of African and Asian one namely Egypt, Sudan, Algeria, Morocco, Tunisia, Nigeria, Kenya, Angola and South-Africa in Africa and China, Japan, Republic of Korea, India, Indonesia, Pakistan, Iran, Turkey and Saudi Arabia in Asia in the case study.
This case study compares the selected economies in fields of employment15-24, over 25 year age, unemployment15-24 over 25 year age, real GDP per employed person and employment – population ratio, which are the main variances of three components in the SPSS (Special Program for Social Science) between 2006.-2014. This study is important because this analyses the economic development conditions of countries by the employment issue, and over this one the Real GDP per employed person and employment-population ratio.
The analysing methods are SPSS (Special Program of Social Sciences), which includes dimension reduction, variability, factor analyse, descriptive statistics and correlations. Also analyse sets up the Pearson correlation and significances in these countries. The data come from EUROSTAT, ILO and some national statistical sources. Economic difficulties of these countries are considerable low of the employment-population ratio, low level of employment and highly level of unemployment. Total variance explained by first three components is initial eigenvalues by 73,176 cumulative percent. The solution for the moderate economic growth is to increase efficient investments for different economic sectors to increase the international competitiveness of the national performance.
Key words: Employment, Unemployment, Real GDP, Statistical analyse, Variances
JEL Classification: J0
1 Introduction
The study analyses economic conditions with employment issue of selected economies, which represent some important different developed one in the developing economic countries, some of them are closed to EU, Turkey is sub-member state of EU, and some crude oil exporting economies, for example Saudi Arabia, Iran, Indonesia and Nigeria, and two leading economies of the world economy, namely China and Japan in this selected countries’ group. The selected countries are consisting of Asian and African one namely China, Japan, Republic of Korea, India, Indonesia, Pakistan, Iran, Turkey and Saudi Arabia in Asia, and Egypt, Sudan, Algeria, Morocco, Tunisia, Nigeria, Kenya, Angola and South-Africa in Africa and in the case study.
The research object is based on employment conditions in some main developing countries in this country-group, which is very actual in order to analyse work possibility for population of these countries and their enough livelihood and also to discover some important difficulties in human resources management at national and international levels. The analyse focuses on the share of the employment in population, the Employment ratio in population and Real GDP per employed person in this country group.
The research extends for some developing countries for example in the MENA Regions consisting of two main regions, namely Middle East (ME) and North Africa (NA) and several other African countries in South of Sahara and China. These selected countries have economic importance and geographic strategy of the world economy and EU. Also for the latest decades China has played more important role in the world economy by financial issues and the moderate cheap labour forces, which last one can contribute to the competitiveness of this country on the world market and the Chinese competitiveness is accompanying with consequent technological development concerning the environmental economic strategy. Therefore the investment can make influences on the employment increase and extending the environment-friendly technology, or by the other famous name at the international level as green technology. Additionally to China, some other Asian countries have implemented considerable development for example Japan, Republic of Korea, India, Indonesia, Pakistan and Iran.
For the possibility of developing employment the green investments can ensure also wide side investment capacity to ensure increasing jobs in these selected countries – African and Asian countries with China. In this case the job-work places creating can and also should accompany with extending environment friendly technology in order to decrease and mitigate gas emission causing the global warming. These green investment strategy appears in the agricultural sector concerning the water management, irrigation and renewable energy resource use (see in Zsarnóczai et al, 2013, p. 367; and Kozár – Neszmélyi, 2014, pp 91-92; and Neszmélyi, 2014).
The economic development either in direction to create new jobs or to follow the green economic development policy for example the new law system of China started by new steps to open wider side possibility for using renewable energy resources. These are follows (Ellis, L.; WRI, 2002) that China’s national policies should be implemented in several fields, as the energy conservation law for determining the national priorities concerning the energy conservation works of local authorities, establishing fund at national and local levels for deciding the tax payment and financial supports, also the loan is to create the energy ensuring projects accompanying with creating more jobs (Government of China, 2008).
Naturally investments to decrease the unemployment rate lead to use more energy, which demands to create the new structure of energy use, for example in case of China. The volume of energy consumption grew rapidly between 2001 and 2011. The Chinese energy consumption grew by almost 140% in this period, although energy use per capita remains below the international average in China, the growing population and its needs will maintain a strong demand for this (Baietti et al, 2012; China CDM Fund, 2011, CDM = Clean Development Mechanism).
Concerning the gas emission, which was 100% in 1971, and this increased from 100% of 1971 to level of 650% in China, to level of 568% in other Asia and 231% in Africa. The world gas emission doubled within this period therefore the increase of gas emission was by 100% more by the end of 2007. In spite that Africa has considerable backwardness in field of gas emission, its gas emission was over level of the world gas emission average, which can be titled as considerable UNCTAD (UNCTAD2008a; UNCTAD2008b). According to the investment activity of China the CDM Fund finance green 10 projects, which would like to developing production process of scale of economy and the research, as its same for development and also and diversifying function advanced equipment. 7 projects of these 10 project account carbon emission reduction by 8 594 300 tonCO2 e/year, which have share as 96,3% of all 10 projects in this program. Also mostly similar economic difficulties of Middle-East and North-African countries with increasing the possible gas emission are at present, as Neszmélyi (2014), when they wrote about the large oil reserves, the opportunity is for foreign mining firms to enter Africa. In cases of Nigeria and Arab countries the crude oil mining sector does not connect with the increasing renewable energy use.
According to the investment activities to increase the job places the well operating and working bank-system and bank-controlling should be set up, therefore the controlling works concerning banks connecting with developing, planning and ensuring issues, which mean first market risk, structure income options and increasing potention”. Also the financial strategy and management at national level should be extended similarly to the firm–level, in which role of governance, organizing, planning and controlling according to well-defined goal criteria; preparation and realization of raising capital owners.
2 Material and Method
This case study compares the selected economies in fields of Empl25 (employment 25 over 25 year age), Empl15-24 (employment15-24 year age), Unempl25 (unemployment 25 over 25 year age), Unempl15-24 (unemployment15-24 year age), RealGDPempl (real GDP per employed person) and EmplPopRatio (employment – population ratio), which are six variances of three components in the SPSS (Special Program for Social Science) between 2006.-2014. This case study is important because this analyse focuses on economic development conditions of the selected countries by the employment issue, and over this one the Real GDP per employed person and employment-population ratio.
The analysing methods are SPSS (Special Program of Social Sciences), which includes dimension reduction, variability, factor analyse, descriptive statistics and correlations. Also analyse set up the Pearson correlation and significances in these countries. The data come from EUROSTAT, ILO and some national statistical sources. Economic difficulties of these countries are low level of employment ratio to population, considerable share of the employment15-24 age employees in employment and highly level of unemployment rate. Also the transfer of youth employed people between 15-24 is very slow to the educational sector to obtain higher educated qualification level. In this case-study based on the SPSS the total variance explained by first three components is initial eigenvalues by 73,176 cumulative percent, which is enough higher for analysing the economic and employment conditions of the selected countries (see Table-5).
The innovation process and development have strong connection with employment issues, therefore this case study focuses on the employment under 25 and over 25 year age employed and unemployed population. The competitiveness of the performance and the value added production within the vertically integrated product channel cannot often provide jobs and increasing level of employment in MENA regions and other developing regions, because more efficient work by using modern technology can lead to decrease number of employees. In North–Africa the unemployment rate has decreased by 4,5% for period of 2000-2010 (ILO, 2011a; ILO, 2011b). In Middle East the unemployment rate was the highest in cases of women and youth generation, as it can be experienced based on the data of ILO, 2010b. The unemployment rate has moderately been decreasing for one decade, and only there was within 1% decreasing from the level of 2000 to the estimated level of 2011 in unemployment issue, this trend was somehow the same as in case of unemployment rate of males. In Middle-East the unemployment rate has decreased only by 0,3% for period of 2000 and 2011, and males unemployment decreased by 0,6% during the same time, which was little higher than in North-Africa by the end of 2011 (ILO, 2010b; IMF, 2010a; IMF, 2010b).
3 Results and Discussion
In general in the world economy the youth under 25 year age unemployment rate has been between 12,8-12,6% for period of 2000-2011, almost double times more than the general unemployment rate in the same time (see ILO, 2010a; ILO, 2010b). But in highly developed economies and EU the youth under 25 year age unemployment rate was higher between 13,5-18,2% in period of 2000-2011, than the average level of youth unemployment rate in the world economy. This situation is caused by less skilled level and knowledge of the youth under 25 year unemployment in the world economy and in the highly developed economies including the EU, than over 25 year old employment. Also in highly developed economies and some developing economies the trend was that the decreasing share of the youth under 25 year, because more youth could continue their study in the education sector. The life-long study program became more favourable and this study ensures for the youth to become more skilled and educated relevant to the demands of labour force market under 25 and over 25 year age.
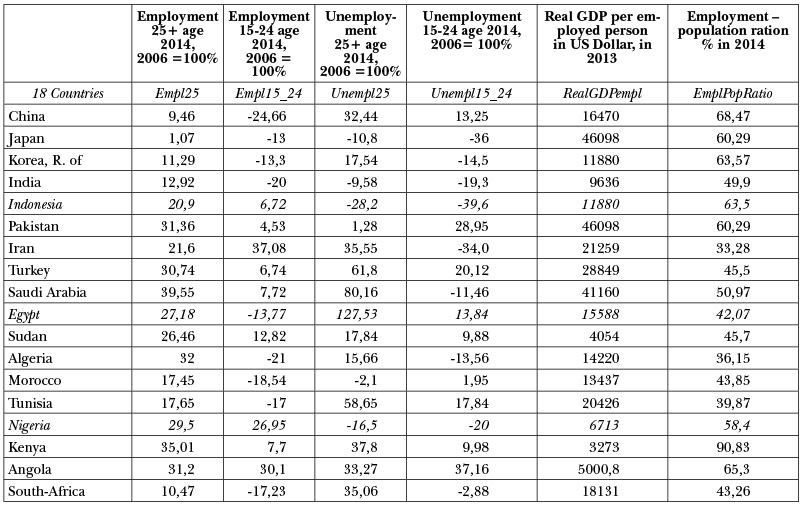
Table-1: The employment over 25, employment 15-24, unemployment over 25, unemployment 15-24, Employment ratio to population in percent between 2006 and 2014 and Real DGP per employed person in Thousand US Dollar in 2013 in selected African and Asian countries
Source: http://www.ilo.org/ilostat/faces/help_home/data_by_country/country-details/indicator-details?country=SDN&subject=CPI&indicator=CPI_TCPI_COI_RT&datasetCode=YI&collectionCode=CPI&_afrLoop=82015456998800#%40%3Findicator%3DCPI_TCPI_COI_RT%26subject%3DCPI%26_afrLoop%3D82015456998800%26datasetCode%3DYI%26collectionCode%3DCPI%26country%3DSDN%26_adf.ctrl-state%3Da9kobqhnx_233
Source: http://www.ilo.org/ilostat/faces/help_home/data_by_country/country-details/indicator-details?country=DZA&subject=UNE&indicator=UNE_2UNE_SEX_AGE_NB&datasetCode=YI&collectionCode=ILOEST&_afrLoop=334014537486198#%40%3Findicator%3DUNE_2UNE_SEX_AGE_NB%26subject%3DUNE%26_afrLoop%3D334014537486198%26datasetCode%3DYI%26collectionCode%3DILOEST%26country%3DDZA%26_adf.ctrl-state%3Dy1vz09xe0_526
Source: ILO, Promoting jobs, protecting people, http://www.ilo.org/global/regions/lang–en/index.htm
http://laborsta.ilo.org/sti/sti_E.html
South Sudan Employment and unemployment in 2008 for 25+ population
Source: http://www.mep.gov.sa/themes/Dashboard/index.jsp#1454160369286, The Saudi Economy of Figures, 2013/G September. Ministry of Economy and Planning, www.mep.gov.sa
Central Department of Statistics and Information, Saudi Arabian Monetary Agency , Ministry of Economy and Planning, GDP growth/C/ 2008-2012
SAMA – 4th Quarterly Statistical Bulletin 2012, Real DGP per capita /I/ 2008-2012, Saudi Arabia
Algeria, Egypt, Morocco, 2004-2014, Long -term unemployment rates, age 15-64, % of labour force,
Employment source: http://ec.europa.eu/eurostat/web/european-neighbourhood-policy/enp-south/data/database
http://ec.europa.eu/eurostat/statistics-explained/index.php/File:Long-term_unemployment_rates_%28persons_aged_15%E2%80%9364%29,_2004_and_2009%E2%80%9314_%28%25_of_labour_force%29_ENPS15.png
Middle East countries: Saudi Arabia, Qatar, Bahrain, United Arab Emirates, Oman, Yemen, Kuwait, Jordanian, Syria, Iraq, Lebanon
North Africa countries: Egypt, Sudan, Somalia, Libya, Tunisia, Algeria, Morocco, Mauritania
Source: ILO, Trends Econometric Models, October, 2010
If the number of employed people over 25 (Empl25) is calculated as 100%, comparably for the ratio of the Empl15-24 (employment between 15-24 year age) as youth under 25 year age employment in several developing countries is considerable. Less than 10% of youth under 25 year age employment comparably to all of the Empl25 is favourable, for example 8,5% in Japan, 7,2% in Korea-Republic-of and 5,8% in Saudi Arabia. In three countries the high education is very strong, which gets many youth under 25year age from the labour force market. The middle range is between 10-15% of Empl15-24 comparably to 100,0% of Empl25 (over 25 year age), in China (14,0%), Iran (14,8%), South-Africa (10%), Tunisia (13,4%), Egypt (15%), Algeria (15%). In these countries, where the ratio of Empl15-24 is between 10-15%, the agriculture sector and the rural areas, mostly unfavourable areas need also for youth employees between 15-24 year age people.
The higher ratio of Empl15-24 is in Morocco (18,5%), Indonesia (17,3%), India (18,5%), also extremely large ratio of Empl15-24 is in Kenya (22,1%), Sudan (22,5%), Nigeria (28,5%), Pakistan (31,7%) and in Angola (36,5%). These developing countries over 20% ratio of Empl15-24 have considerable economic backwardness, therefore they do not need for skilled workers, even they cannot and also they do not want to pay higher wages for the youth skilled workers. The agricultural sector and the family jobs need these not skilled youth workers (data come from sources of the Table-1, ILO from different years).
There is a large gap between males, females and youth employment ratio in Middle East and North-Africa, also not enough supports for SME-s to extent their employment (ILO, 2011a and 2011b). But in some crude oil exporting countries as Saudi Arabia and Iran the advanced logistic system ensures the technical and physical background of product channel for highly developed transport network, mining sector and manufacturing industries. Also the middle and high educational systems can ensure the increasing educated level of labour force in some countries of Middle East and North Africa, in order that the efficiency of labour force can be realised and to be competitive. The considerable incomes coming from mining sector ensure one of the most important economic development trends in the world economy in fields of investment activities and stimulating the foreign direct investments (FDI) in Saudi Arabia (SAMA, 2011, 2014; RMEP, 2010, 2014).
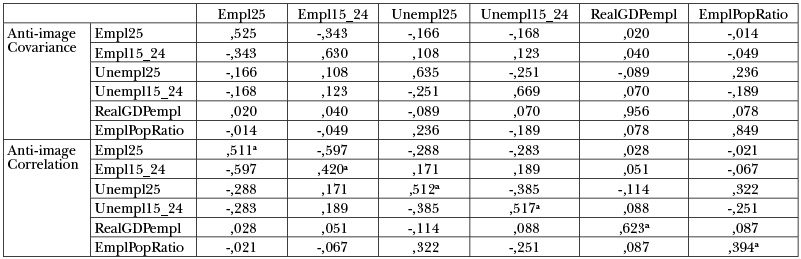
The tables providing statistical data can provide clear overview for employment issues and economic conditions for the selected countries from two continents, namely Asia and Africa. These selected countries are representing the special conditions of the developing countries and specially Asia and Africa. According to the Table-2 the value of the KMO Kaiser-Meyer-Olkin Measure of Sampling is 0,487, as 48,7%, which shows moderate similarity to variances. If the value of the KMO is higher than 50%, the similarity and the correlation among variances can moderately be strong. In the last line of the Table-2 also because of the significance is 0,436 and it is little far from 0,000, therefore this significance is moderately strong among variances, as Empl25, Empl15-24, Unempl25, Unempl15-24, RealGDPempl and EmplPopRatio. The significance is explained by 15,222% under title of Approx. Chi-Square in the second line of the Table-2, which show that not all variances can be strongly closed to each other. In the Table-3 the average value of the figures signed by “a” in the Anti – image Correlation gives the value of the KMO in the first line of the Table-2. In the Table-3 this diagonal line starting with figure 0,511a to figure 0,394a show measure of dependence of variances from other one and how the correlation is strong or weak among different variances.
If the values of variances on the diagonal line in section of Anti-image Correlation in the Table-3 are more than 0,500 or 50% (0,500 = 50%), in this case the each variance has strong or stronger correlation with other variances. If the value of variances are less than 50% (0,500), in this case the variances have weak correlations with other one. In the Table-3, four variances namely Empl25 (0,511 = 51%), Unempl25 (0,512 = 51%), Unempl15-24 (0,517 = 51,7%) and RealGDPempl (per employed person, 0,623 = 62,3%) have values more than 50%, which means that they have strong correlations with each other, but the other variances have weak correlation with other variances in case of Empl15-24 (0,42 = 42%) and EmplPopRatio (0,394 = 39,4%).
Table-2: KMO and Bartlett’s Test

Source: Owned calculation by SPSS
Table-3: Anti-image Matrices concerning the employment over 25, employment 15-24, unemployment over 25, unemployment 15-24, Employment ratio to population in percent between 2006 and 2014 and Real DGP per employed person in Thousand US Dollar in 2013 in selected African and Asian countries
a. Measures of Sampling Adequacy(MSA)
Source: Owned calculation by SPSS
a = the average value of the figures signed by “a” in the Anti – image Correlation gives the value of the KMO in the first line of the Table-2
RealGDPempl (per employed person) in 2013
Table-4: Communalities

Extraction Method: Principal Component Analysis.
Source: Owned calculation by SPSS
In the Table-4 values of the variances in the Extraction show that how the each variance explains the principal three components commonly. If the values of the variances are more than 0,500 or 50% they have strong influences on the creating principles components. In this Table-4 the variance Empl25 has strong influence by 0,829 (82,9%) and even the Empl15-24 variance by 0,884 (88,4%), the Unempl25 (over 25 year age people) by 0,785 (78,5%), Unempl15-24 by 0,807 (80,7%), also the variance EmplPopRatio has strong influence by 0,652 (65,2%). Only the RealGDPempl (per employed person) have weak influences on the creating principle components by less than 50%, namely 0,434 (43,4%). Generally most of the variances have considerable influences on three principle components.
Table-5: Total Variance Explained concerning the employment over 25, employment 15-24, unemployment over 25, unemployment 15-24, Employment ratio to population in percent between 2006 and 2014 and Real DGP per employed person in Thousand US Dollar in 2013 in selected African and Asian countries

Extraction Method: Principal Component Analysis.
Source: Owned calculation by SPSS
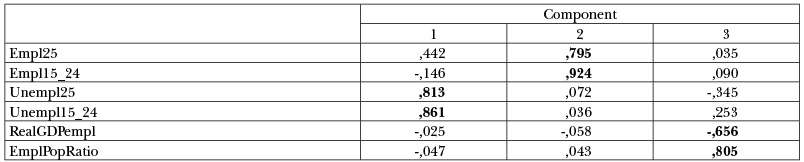
Table-6: Rotated Component Matrixa concerning the employment over 25, employment 15-24, unemployment over 25, unemployment 15-24, Employment ratio to population in percent between 2006 and 2014 and Real DGP per employed person in Thousand US Dollar in 2013 in selected African and Asian countries
Extraction Method: Principal Component Analysis.
Rotation Method: Varimax with Kaiser Normalization.a
a. Rotation converged in 4 iterations.
Source: Owned calculation by SPSS
In the Table-5 total variances explained by the first three components is initial eigenvalues by 73,176 cumulative percent. In the Table-6 in the first principle component the variances are Unempl25 by 0,813, Unempl15-24 by 0,861, in the second principle component the variances are Empl25 by 0,795, Empl15-24 by 0,924, in the third principle component the variances are
the RealGDPempl by -0,656, EmplPopRatio by 0,805 (See Table-6). Two variances of the first component, two variances of the second component and two variances of the third component have more different values from the other variances of three components, therefore differences of two variances of each components can provide possibility to explain their correlations and the economic conditions from point of view of the employment conditions, RealGDPempl and EmplPopRatio variances.
Table-7: Correlations concerning the employment over 25, employment 15-24, unemployment over 25, unemployment 15-24, Employment ratio to population in percent between 2006 and 2014 and Real DGP per employed person in Thousand US Dollar in 2013 in selected African and Asian countries
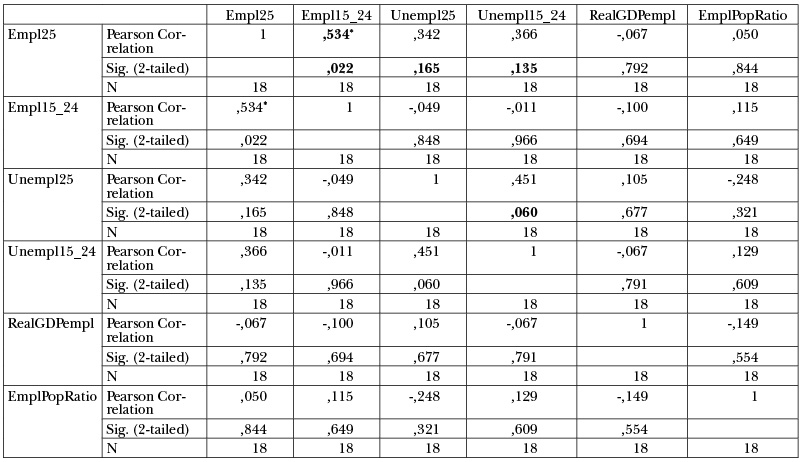
*. Correlation is significant at the 0.05 level (2-tailed).
Source: Owned calculation by SPSS
The Table-7 provides very clear overview for the Pearson correlation among different variances. The data over the diagonal line of the Number “1” to the right can be seen to determine correlation among variances, because the data are the same from diagonal line Number “1” to the left side, therefor the right side data are enough for the analysing. If the values of the Pearson Correlation are more than 0,500 (50,0%) either minus or plus values, this means that the correlation is strong among variances, if these values are under 0,500 the correlation is weak among the variances.
In the Table-7 the strongest correlation is 0,534 between Empl25 and Empl15-24. This means, that in this country-group of 18 countries, that in the case of the Empl25 increase, the Empl15-24 also increases, or by the other way, if the Empl25 decreases, also the Empl15-24 can decrease, because both of them are dependent on each other and the common economic background or the world economic influences.
Also in this Table-7 the strong significant is among variances namely Empl25 with Empl15-24 by 0,022 and Unempl25 by 0,165, also Unempl15-24 by 0,135. In case of significance if the value of variances are closed to 0,000 (0,0%) the significance is strong among variances, but if it is far from “zero”, the significance is weak. Therefore when Empl25 increases the other variances Empl15-24, Unempl25 and Unempl15-24 also increase, or opposite, when the Empl25 decreases, above mentioned three variances also decrease. Also the Unempl25 has strong significance by 0,060 (6,0%) with Unempl15-24, when the increasing rate of Unempl25 is occurring, the Unempl15-24 can increase or opposite, when they decrease in the same time. These unemployment conditions can be happened because of the declining or increasing rate of performance, therefore the labour market demands are fluctuating relevant to the changing rate of performance.
The significance can be weak between Empl15-24 from one side and Unempl25 and Unempl15-24 from the other side. The Empl15-24 can decrease, when the part of the Empl15-24 transfer to the Empl25 or to the educational sector, or also some of youth people can get social support for creating family in case of child-born. In these cases the changes of Empl15-24 do not make influences on increase or decrease of Unempl25 and Unempl15-24. Also the other variances do not have strong correlation and significance, for example in case of two variances, namely RealGDPempl and EmplPopRatio. This means that if the employment-population ratio increases or decreases, the Real GDP per employed person and Employment-Population Ratio can be independent from each other, or their mutual connection (correlation and significance) can be weak. For example if the increasing ratio of employment in all population can be stimulated by national or foreign investments in a country, but at national economic level the efficiency of performance as real GDP per employed person can decrease. Also the RealGDPempl and EmplPopRatio do not have strong correlation with other variances, namely Empl25, Empl15-24, Unempl25 and Unempl15-24.
When employment and unemployment decrease or increase, the EmplPopRatio can independently change or even this one stagnates in the same time. Naturally the EmplPopRatio can be depend on the conditions of the inactive population, from point of view of their education or family situations concerning the escape from labour market. At the company level the production efficiency and productivity can increase, for example net income from sale, taxed profit and profit from business activity per average number of employees or per employed person, but at the national level this does not mean that productivity of companies can increase directly the Real GDP per employed person. In spite of this contradiction the role of RealGDPempl and EmplPopRatio are very important to indicate the general economic conditions of national economies. Therefore these data also are needed for the analysing (see Table-7). Based on these data naturally these employment conditions can be analysed in different countries.
The Figure-1 and Figure-2 provide clear overview for the employment conditions concerning the economic growth of selected countries of Asia, Africa and China between 2006 and 2014. The values of the variances of components (see Table-6) are general average of 18 countries in Africa and Asia.
Figure-1: Factor analyses for selected African and Asian countries with China between 2006-2014
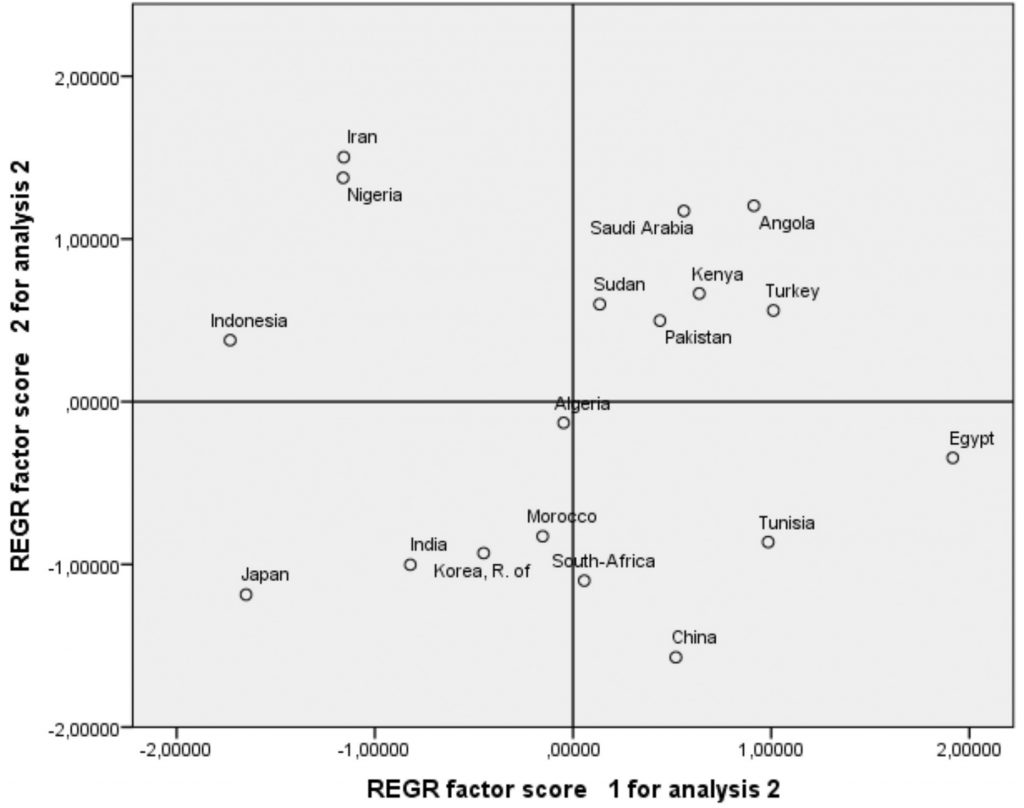
Source: Owned calculation by SPSS
REGR Factor Score-1: At Principle line horizontal “X”, Variances: Unempl25 (over 25 year age); and Unempl15-24
REGR Factor Score-2: At Principle line vertical “Y”, Variances: Empl25 (over 25 year age); and Empl15-24
Figure-2: Factor analyses for selected African and Asian countries with China between 2006-2014
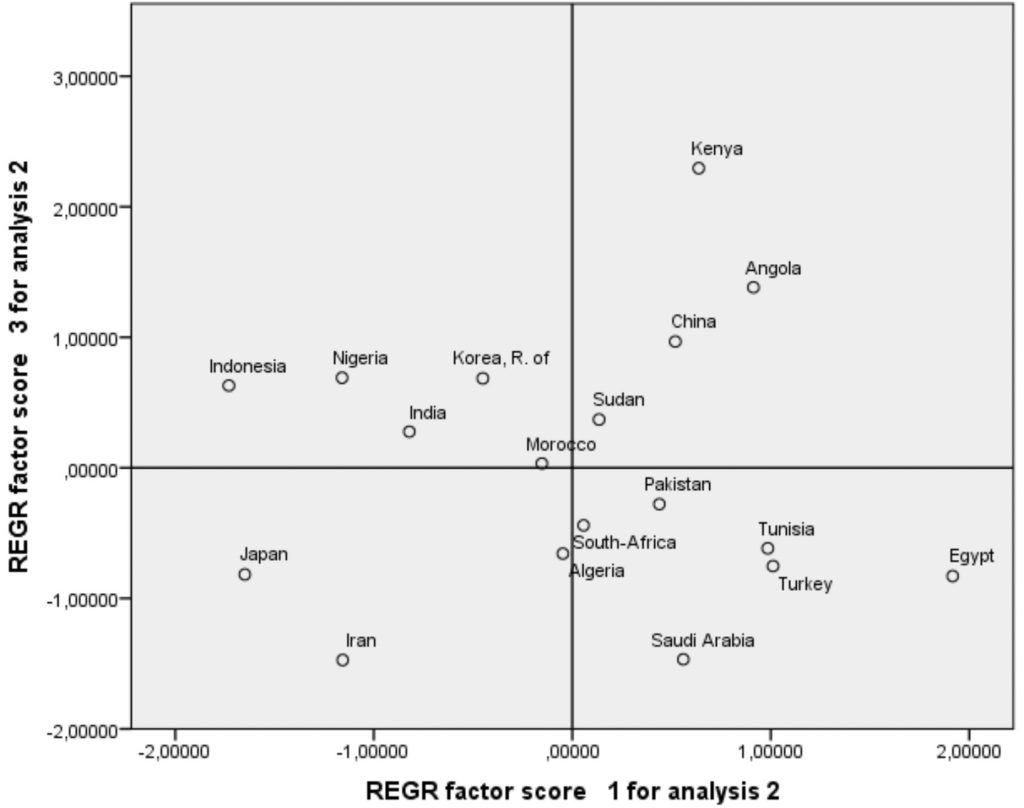
Source: Owned calculation by SPSS
REGR Factor Score-1: At Principle line horizontal “X”, Variances: Unempl25 (over 25 year age); and Unempl15-24
REGR Factor Score-3: At Principle line vertical “Y”, Variances: – RealGDPempl; and EmplPopRatio
At the principle line of “X”, in the right side, above this line the Unempl25 and Unempl15-24 increase in those countries, which are namely Saudi Arabia, Turkey, Kenya, Angola, Sudan, and Pakistan. In these countries the Unempl25 has considerably increased for the period of 2006 and 2014, for example 80,16% in Saudi Arabia, 61,8% in Turkey, 37,8% in Kenya, 33,27% in Angola, 17,8% in Sudan, and 1,28% in Pakistan, but in Pakistan the Unempl15-24 was also considerable, namely 28,9%. In these countries the Empl25 and Empl15-24 increased, for example the Empl25 increased by 39,5% in Saudi Arabia, 31% in Turkey, 35% in Kenya, 31% in Angola, 26,4% in Sudan, and 31,4% in Pakistan. The increase of Empl15-24 was also in these countries, but this was not so considerable. In Saudi Arabia the Empl25 has reached the top increase in group of 18 countries by 39,5% for the period of 2006-2014. The increasing number of Unempl25 has been only a little, namely about 200 thousand persons for the period of 2006-2014, while the Unempl15-24 decreased by 36 thousand persons in the same period. By the end of 2014-2015 about 6 million foreign guest workers mostly coming from Bangladesh, India and Pakistan were employed in Saudi Arabia with their foreign 4 million relatives. All of the population of Saudi Arabia was 30 million people. Naturally the large volume of RealGDPempl was resulted by the intensive and very efficient crude oil mining sector and the chemical industry.
At the principle line of “X” on the right side, down line, in this quarter of the coordinate system the Unempl25 and Unempl15-24 increase in those countries, namely Egypt, China, Tunisia and South-Africa. The Unempl25 increased by 127,5% in Egypt, 32,44% in China, 58,6% in Tunisia and 35,06% in South-Africa. But the Unempl15-24 little increased in these countries.
In China the Empl25 has increased by 9,46% for the period of 2006-2016, but this increase was equal with 58,2 million persons, while the Empl15-24 decreased by 24,66% and by 30,1 million persons, mostly they have transferred to the Empl25 and educational sector, partly middle and high education institutions, and education for skilled workers for the same period of 2006-2014. Also in China, when the Unempl25 increased by 32,44%, in spite that this was considerable, but this equalled with 5,9 million persons in the same period. Because of the decrease of Empl15-24 was considerable, therefore China was shown in this quarter of coordinate system (“X” line, under the right side, in Figure-1). Naturally the new economic strategy with using advanced technology demands for skilled workers, who can mostly over 25 year old, therefor first in China the employment conditions became more favourable for this age of population, who can get more experiences with education, special courses for skilling and with longer time period in practice, mostly over 25 year old. These economic development trend and conditions can explain the high share of the employment over 25 in China (see Table-1, Figure-1). Naturally the extending share of employment25 over 25 year age can also be followed in some other MENA and African countries.
At the principle line of “X”, in the left side, above this line the Unempl25 and Unempl15-24 decrease in those countries, which are namely Iran, Nigeria and Indonesia. In these countries the Unempl25 has considerably decreased for the period of 2006 and 2014. But this was different per each country, namely Unempl25 increased by 35,5% in Iran, but decreased by 16,5% in Nigeria and 28,2% in Indonesia. The Unempl15-24 decreased by 39,6% in Indonesia, 34,0% in Iran and 20,0% in Nigeria. Because Unempl15-24 decreased considerably in Iran, therefore Iran is shown in this quarter of the coordinate system.
In these countries the Empl25 and Empl15-24 increased, for example the Empl25 increased by 29,5% in Nigeria, 21,6% in Iran, 20,9% in Indonesia. The increase of the Empl15-24 was not considerable in these countries, expect in Iran, where this has decreased by 37,0% for this period of 2006-2014.
At the principle line of “X”, in the left side, under this line the Unempl25 and Unempl15-24 has decreased in Algeria, Morocco, Japan, India and Korea-Republic-of. The Unempl25 has decreased by 10,8% in Japan, 2,1% in Morocco, 9,6% in India, but this has increased by 15,6% in Algeria and by 17,5% in Korea-Republic-of for this period of 2006-2014, while in these two countries the Unempl15-24 decreased considerably by 13,6% in Algeria and 14,5% in Korea-Republic-of. Also the Unempl15-24 decreased by 36% in Japan, which can be seen considerable.
In these countries the decrease of Empl15-24 was about between 13- 21% and the increase of Empl25 was mostly between 1% in Japan and 17% in Morocco, but 32,0% in Algeria. Because of the decrease of Empl25 was more considerable therefore these countries became selected in this quarter of the coordinate system.
According to the Figure-2, at the principle line of “X”, in the right side, above this line the RealGDPempl was at low level in Kenya, Angola and Sudan with less of EmplPopRatio, expect Kenya, where this ratio was 90,0% because of the important role of the agricultural sector was in field of employment.
But in China the RealGDPemp was considerable with highly level of EmplPopRatio by 68,5%. This ratio was the highest after Kenya, but Kenya has agricultural sector with high share in employment. China could realise considerable level for increasing RealGDPempl, while also Empl25 increased by 9,5% with 58,3 million persons, and Unempl15-24 mostly stagnated, in spite that Empl15-24 decreased by 24,66% with 30,7 million persons, and Unempl25 increased by 32,44% with 165,3 thousand persons. China could also realise the labour force transfer from Empl15-24 to Empl25. This result also could help this country to increase employment level with increase the number of employees of Empl25. China could increase the RealGDPempl as much as increase Empl25 and stagnated Unempl15-24. The Chinese employment policy was successful, which helped China to realise growing rate for RealGDPempl as same as growing rate of Empl25.
At the principle line of “X”, in the right side, under this line these countries, namely Pakistan, South–Africa, Tunisia, Turkey, Egypt and Saudi Arabia have mostly increasing Unempl25 and Unempl15-24 growing rate, while their RealGDPempl increases and their EmplPopRatio has decreasing growing rate, opposite to the one in the right side over “X” line.
In Egypt the increase of the RealGDPempl occurred because of little crude oil export, the fee for passing the Suez Canal and the somehow active tourism sector. Also the tourist sector can ensure a minimum income for the country to increase the Real GDP per capita employment in Tunisia.
At the principle line of “X”, in the left side, above this line the RealGDPempl was at low level in Nigeria and India with less of EmplPopRatio, namely 49% in India and 58% in Nigeria, but the RealGDPempl was higher in cases of Korea-Republic-of and Indonesia with moderate better position in case of the EmplPopRatio, namely 63%. In Morocco the position is opposite, because the RealGDPempl is better than the general value of developing countries, but the EmplPopRatio was less than 50% of population by the end of 2014. In this session generally in those countries, where the EmplPopRatio is high, the RealGDPempl can be at low level, first in cases of India and Nigeria. In case of Morocco the EmplPopRatio, namely 43,8% in 2014 was at low level but the RealGDPempl was high. Naturally these data of EmplPopRatio and RealGDPempl cannot always decide the position of countries in the REGR Factor Score (as Coordinate system), because the Employment and Unemployment conditions have considerable effects of their positions (see Figure-2).
At the principle line of “X”, in the left side, under this line generally the EmpPopRatio is decreasing and the RealGDPempl is increasing, which can be proofed by examples of Japan, Iran and Algeria. In Iran the EmpPopRatio was very low level, namely 33,28% with increasing Unempl25 by 35,5% and decreasing Unempl15-24 by 34% by the end of 2014, while the RealGDPempl was considerably high. This means that the Unempl25 increased by the same rate, when in the same time the Unempl15-24 decreased, which resulted that the EmpPopRatio could not change, but the RealGDPempl remained at high level, because of the considerable crude oil sector’s prosperity. In general the economic and employment conditions were the same in Algeria similarly to Iran’s one, because the Unempl25 increased mostly as same as the decreasing rate of the Unempl15-24, therefore the EmplPopRatio remained mostly at earlier level, while the RealGDPempl increased considerably. In Japan either Unempl25 or Unempl15-24 moderately decreased in the same time, but the low level of the EmplPopRation remained at low level, while the RealGPDempl was at highly level. Naturally the advanced technology and strong innovation prosperity of Japan contributed to create large value of the RealGDPempl in the first half of 2010 years (see Figure-2, and Table-8). The economic results of Japan were very successful, because RealGDPemp was high and also the EmplPopRatio was relatively high, decrease of Unempl25 and Unempl15-24 decreased, and the Empl15-24 decreased for extending the education programs for youth people.
In Iran and Saudi Arabia could realise a successful growing rate for the Real GDP per employed person (RealGDPemp) because of the increasing crude oil production and export. Also Turkey could implement a quite good increasing RealGDPemp, while the increasing rate of Empl25 (30,7%) was considerable, and the increasing rate of Unempl25 (61,8%) and Unempl15-24 (20,1%) were also considerable, but at all the employment rate increased by more than 5 million employed persons, while the unemployed persons increased by less than one million persons, therefore the balance of employment and unemployment has been positive toward to employment growth in period of 2006-2014. The Unempl25 increased more, mostly three times, than Unempl15-24. In case of Turkey the considerable increase in RealGDPemp was resulted by increase of Empl25 mostly in agricultural sector, in several concentrated industrial large companies, Unempl25 and Unempl15-24 increased by 61,8%, with less one million persons and also the Turkish guest workers in EU, first in Germany and remitting their salaries to Turkey to increase RealGDPemp, while the EmplPopRatio remained relatively at low level, namely 45,5% (see Table-1).
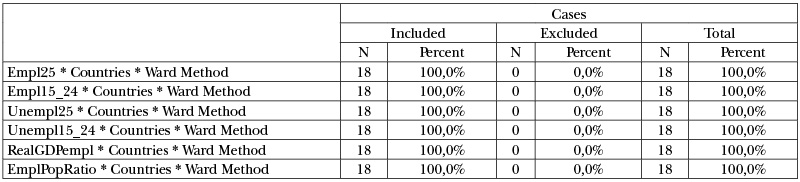
Table-8: Case Processing Summarya concerning the employment over 25, employment 15-24, unemployment over 25, unemployment 15-24, Employment ratio to population in percent between 2006 and 2014 and Real DGP per employed person in Thousand US Dollar in 2013 in selected African and Asian countries
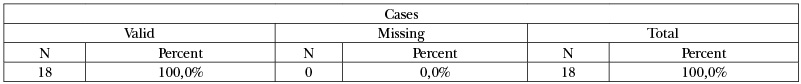
a. Squared Euclidean Distance used
Source: Owned calculation by SPSS
Table-9: Proximity Matrix
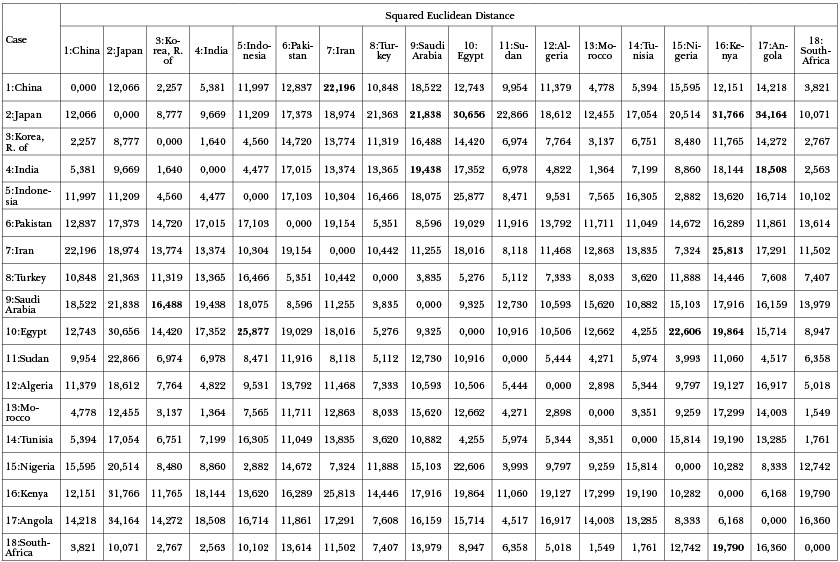
This is a dissimilarity matrix, Source: Owned calculation by SPSS
According the Table-9: Proximity Matrix within the Squared Euclidean Distance based on the owned calculation by SPSS the difference of the economic developed levels for 18 countries of the research. The data show differences based on the basic statistics from employment, unemployment issues, the RealGDPempl and EmplPopRatio among countries. These data only show the differences of countries’ performance and not the developed level of each countries opposite to other one. Naturally the known economic background of the countries can clear the developed levels of countries against the other one.
In the cases of several countries Japan has the biggest differences against other countries, for example 34.164 from Angola, 31.766 from Kenya, 30.656 from Egypt, 21.833 from Saudi Arabia. The important country, as China has difference or distance as 22.196 from Saudi Arabia, while India has difference as 19.438 from Saudi Arabia and 18.508 from Kenya; Kenya has 25.813 from Iran. Egypt has difference as 25.877 from Indonesia, 22.606 from Nigeria and 19.864 from Ke-nya, while South-Africa has difference as 19,790 from Kenya.
These data show that the well developed country Japan and also China with favourable economic conditions have large differences or distances from other countries of this country-group. Also the crude oil producing and exporting economies, as Saudi Arabia, Iran and sometimes Nigeria have considerable distance from most of developing economies. In some cases some developing economies have also considerable distance from other developing one, for example Egypt has distance from Kenya, Pakistan and India. Naturally not Egypt has more economic developed level in all of the cases, because India and Pakistan could realise more attractive economic results than in some cases of Egypt. India and Pakistan became more diversified economic countries, than Egypt from point of view of mining sector and manufacturing sectors and light industries.
Figure-3: Cluster analyse for selected African and Asian countries
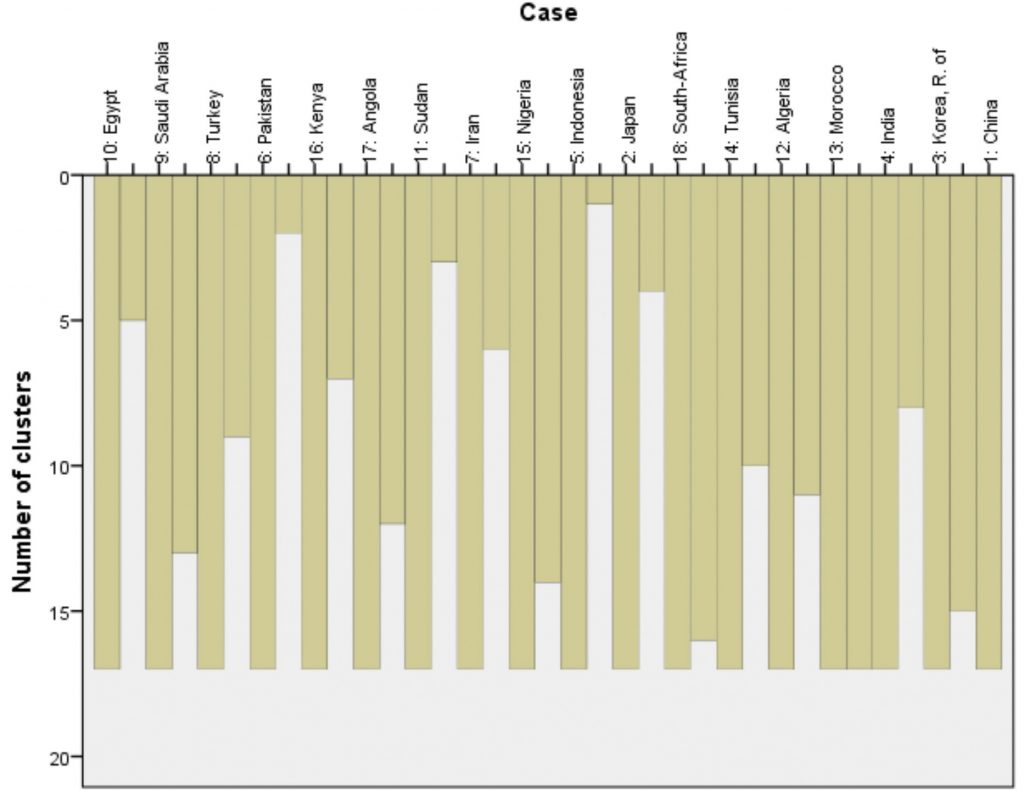
Source: Owned calculation by SPSS
Figure-4: Dendrogram using Ward Linkage based on the cluster analyse for selected African and Asian countries
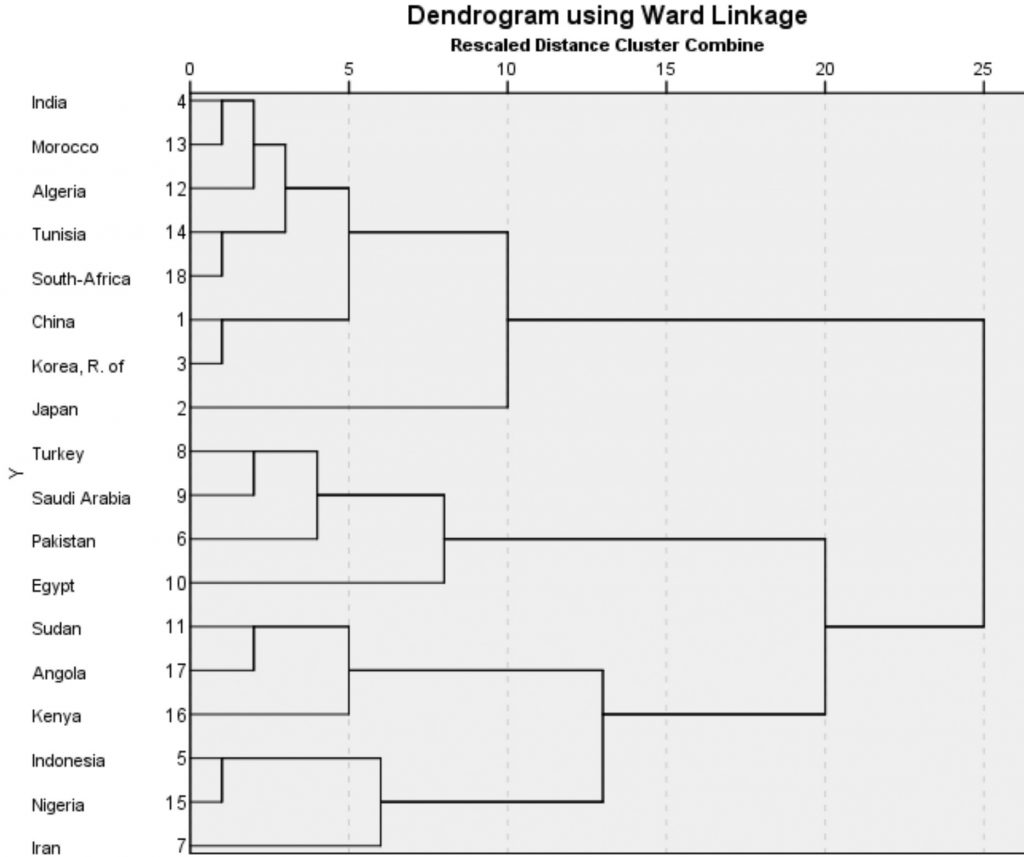
Source: Owned calculation by SPSS
The Figure-3 and Figure-4 well show clusters of the selected countries of MENA regions, Africa and China, clusters are relevant to the coordinate system in Figure-1. If the Dendrogram is cut at line between 10 and 15, therefore four country-groups will be created (see Figure-4). The First group can be seen in the coordinate system down principle line “X” to the right and left sides (see Figure-1). The second country group included Sudan, Angola, Kenya is above the principle “X” line to the right side from the Origo. The third country-group included Turkey, Saudi Arabia, Pakistan and Egypt above principle “X” line to the right side from the Origo, but Egypt is alone closed to the “X” line from under this line. The fourth country-group included Indonesia, Nigeria and Iran is above “X” line to the left side from the Origo. Countries of each country-group are similar to each other within a group based on their performances and general economic conditions by average values of economic variances (Table-1). The Table-10 shows the role of variances in this SPSS analyse with percent based on the Ward Method.
In Figure-4 the Dendrogram is using Ward Linkage based on the cluster analyse for selected African and Asian countries, where if country-groups are selected by line 10, therefore four country-groups can be created, first group with 8 countries, the second one with 3 countries, the third one with 4 countries and the last fourth one with also 3 countries. The Table-11 following the structure of Figure-4 clears the characters of each country-group by their performance and employment conditions. Therefore the Table-11 uses 4 country-groups.
Table-10: Case Processing Summary concerning the employment over 25, employment 15-24, unemployment over 25, unemployment 15-24, Employment ratio to population in percent between 2006 and 2014 and Real DGP per employed person in Thousand US Dollar in 2013
Source: Owned calculation by SPSS
Table-11: Case Summariesa concerning the employment over 25, employment 15-24, unemployment over 25, unemployment 15-24, Employment ratio to population in percent between 2006 and 2014 and Real DGP per employed person in Thousand US Dollar in 2013

a. Limited to first 100 cases.
Source: Owned calculation by SPSS
Table-12: Descriptive Statistics concerning the employment over 25, employment 15-24, unemployment over 25, unemployment 15-24, Employment ratio to population in percent between 2006 and 2014 and Real DGP per employed person in Thousand US Dollar in 2013 in Minimum, Maximum, Mean and Std. Deviation
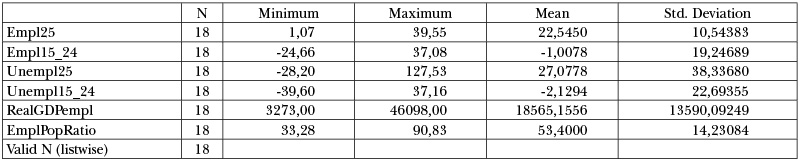
Source: Owned calculation by SPSS
The Table-12 shows the values for each variance according to each country and the Std. Deviation is the average difference or distance between the average minimum and average maximum values within each country-group. Based on the data base concerning values of the variances of each country the cluster system concerning the coordinate system (Figure-1, Figure-2) was created.
According to the international resources the FDI (Foreign Direct Investment) can create the strong employment conditions based on the vertically integrated product channel accompanying with extending high-tech and ensuring products to supply market of EU (see in detailed in WIR, 2014). The FDI can focus on the increasing foreign human resources instead of domestic-national workers-employees (WEF = World Economic Forum, 2010).
Cole (1988) emphasized wage conditions of company effecting the RLP (real labour productivity) growth was to pay for employees, for example for encouraging the optimum productivity from employees; for enabling employees to share in the growth and prosperity of the organization; and also for ensuring the labour costs are suitably controlled in relation to other costs and in relation to revenues. The productiveness of labour force is very considerable to strengthen competitiveness on the world and national markets. Naturally there are some other costs of labour force, for example adjustment costs are for developing their skill and knowledge. The increase the skill and knowledge level of employees in order to strengthen their positions, the labour productivity and the integration of women and youth employees on labour markets and also to weak dependence from poverty and poor employment. (ILO = International Labour Office, 2011b). In research of the article the efficiency of the production was analysed at national level under the data of RealGDPempl, as Real GDP per employed person in selected countries.
Conclusions
The solution for the moderate economic growth is to increase efficient investments for different economic sectors to increase the international competitiveness. In order to create the favourable economic conditions, this needs for increasing Empl25 to extend the domestic market of national economy, less Unempl25 and Unempl15-24, to increase the EmplPopRatio and its share of Population, intensive international competitiveness of national performance and companies. The plan is to increase the efficiency of the production and increase the RealGDPempl. Empl15-24 should decrease in order that this generation of 15-24 age population is to study in educational sector, mostly at middle and high levels, as BSc, MSc and PhD.
References
1. Baietti A – Shlyakhtenko A – La Rocca R – Patel D U (2012): Green infrastructure finance: leading initiatives and research, World Bank Study, Washington, D.C.
2. China CDM Fund (2011): Annual Report 2011, Beijing, p. 45
3. Cole, G. A. (1988): Personnel management, D.P. Publications Ltd, London
4. Ellis L (2008): Efforts in Moving towards a Low Carbon Future: China’s Energy Conservation and Renewable Energy Laws, The Wilson Centre, February 13,2008. Retrieved on 11/25/2010 from http://www.wilsoncenter.org/index.cfm?topic_id=1421&fuse-
action=topics.event_summary&event_id=370725
5. Government of China (2008): China’s Policies and Actions for Addressing Climate Change, Information Office of the State Council of the People’s Republic of China, October 2008. Retrieved on 11/25/2010 from http://www.gov.cn/english/2008-10/29/content_1134544.htm
6. ILO (International Labour Office, 2010a), Global employment trends for youth, August, 2010 – Special issue on the impact of global economic crisis on youth, Geneva, Geneva, Switzerland, ISBN 978-92-2-124546-9
7. ILO (2010b), Trends Econometric Models, October, 2010, Geneva
8. ILO (2011a): Global employment trends – 2011, Geneva, Switzerland ISBN 978-92-2-124546-9
9. ILO (2011b): World of Work Report 2011. Making markets work for jobs. INTERNATIONAL LABOUR ORGANIZATION, INTERNATIONAL INSTITUTE FOR LABOUR STUDIES, 978-92-9014-974-3 (print) Geneva, 2011
10. IMF (2010a), Regional Economic Outlook: Middle East and Central Asia, in the World Economy and Financial Surveys, Washington, DC, May 2010. Also IMF, World Economic Outlook, October 2010.
11. IMF (2010b), World Economic Outlook: Recovery, risk and rebalancing, Washington, DC, October 2010
12. Kozár L – Neszmélyi Gy I (2014): Water Crisis in the Nile-Basin -: Is It Really a Zero Sum Game? Journal of American Business Review, Cambridge 2: (2) pp. 91-98.
13. Neszmélyi, Gy. (2014): The Impacts of the Arab Spring on the Egyptian Economy. Selye E-Studies (ISSN: 1338-1598) 14 p. http://www.ujs.sk/gtk/e-studies/hu.html?start=5
14. RMEP (Report of Ministry of Economy and Planning, 2010, 2014): Saudi Arabia, Riyadh, 2010-2014
15. SAMA (Saudi Arabian Monetary Agency, 2011, 2014), Annual Report and Statistical Summary, Riyadh
16. UNCTAD (2008a), UN Conference on Trade and Development, 2008
17. UNCTAD (2008b), UN Conference on Trade and Development, 2008: World Investment Report
18. WIR (World Investment Report, 2014): Investing in SDGs, An Action Plan
19. WRI (World Resources Institute, 2002), China: Cleaner Production Promotion Law, World Resource Institute (WRI), 2002. Retrieved on 12/15/2010 from http://projects.wri.org/sd-pams-database/china/cleaner-production-promotion-law
Resources from WEB sides
In Saudi Arabia source of Price index coming from http://www.mep.gov.sa/themes/Dashboard/index.jsp#1454160369286
The Saudi Economy of Figures, 2013/G September. Ministry of Economy and Planning.
Central Department of Statistics and Information, Saudi Arabian Monetary Agency , Ministry of Economy and Planning, GDP growth/C/ 2008-2012
Source coming from: http://www.mep.gov.sa
SAMA – 4th Quarterly Statistical Bulletin 2012, Real GDP per capita employment /I/ 2008-2012
Algeria, Egypt, Morocco, 2004-2014, Long-term unemployment rates, age 15-64, % of labour force, Employment, Source coming from http://ec.europa.eu/eurostat/web/european-neighbourhood-policy/enp-south/data/database
Algeria, Egypt, data coming from http://appsso.eurostat.ec.europa.eu/nui/show.do (in Million Euro and GDP per capita in Euro in Region of the European Neighbourhood Policy)
HICP data coming from http://ec.europa.eu/eurostat/tgm/table.do?tab=table&init=1&plugin=1&language=en&pcode=tec00118
http://ec.europa.eu/geninfo/legal_notices_en.htm
JEL Classification Codes Guide: https://www.aeaweb.org/jel/guide/jel.php
Zsarnóczai, J. Sándor
Associate Professors, Institute of Regional Economics
and Rural Development
Faculty of Economic and Social Science,
Szent István University

@ WCTC LTD --- ISSN 2398-9491 | Established in 2009 | Economics & Working Capital