Environmental economics in EU and Hungary in 2010s
Abstract
The environmental economic analyses became very actual, because of the negative influences of the human activities and the performances of the economies of the world economy including the EU-28 member states on the nature. The case study focuses on the environmental economic issues in the EU-28 based on the data bases concerning the different variances from the SPSS system. The statistical data based on the SPSS show that the correlation among ten variances are very strong by 93,3% and also the significance is very strong among themselves. The data shows the Total Variance Explained by the Initial Eigenvalues in Cumulative by 74,074%, which means that the first four components explain the correlations among variances by 74,074%. The Rotated Component Matrix shows four components, and each component including different number of variances.
The main economic difficulty is for the EU the unemployment rate increased by 2,1%, while the GDP average growth rate was just only by 1% – one percent – between 2006-2015, which is unfavourable economic growing conditions. The EU has also a considerable problem concerning the Generation of waste by economic activity (variance: GenWasteTo) from point of view of the environmental conservation strategy. Because the EU has increased the Generation of waste by 44,4% since 2004.
Hungary has decreasing unemployment rate by 0,7%, which is considerable in the EU-28. The GDP growth of Hungary has increased rate by 2% since 2010. Hungary has 32% increasing rate for the resource productivity, which can be mentioned as good, because it is closed to the average level of EU, as 31,5% increasing rate since 2010. Hungary could have decreased the GHG gas emission by 61,0% since 1990 less than average GHG gas emission decrease of EU, which was 81,38% in the same time. Hungary decreased the Generation of waste by economic activity by 32,5% against 44,5% increase of EU in the same time.
The salinization process can be considered almost on 3,8 million ha areas of Europe. Also the soil contaminations included heavy metal and mineral oil widely extended in 3 million sites of Europe. Hungary could have realised considerable decreasing rate by 76,0% in municipal waste by two times more than the EU decreasing average level, as 38,17% since 2005.
In EU the energy intensive increased by 186,98% from 2006 and therefore the energy use is not productivity. This situation increases the one-side energy dependence for EU and opposite to the original energy strategy in Rome Treaty in 1956. Also the Resource productivity should be developed in EU in order to obtain and increase more competitive position for EU on the World economy, because its growth was only by 31,5% from 2010.
Keywords: SPSS analysis, Variances, Generation of waste, Energy intensive, Productivity
JEL code: Q25, Q40, Q53, Q54
Introduction
The environmental economic analyses became very actual, because of the negative influences of the human activities and the performances of the economies of the world economy including the EU-28 member states on the nature. Therefore performance of the mankind and human activity resulted in the intensive greenhouse gas (GHG) emission, which leads to the global warming and the increase of the sea-level. The basic solution is to stop this global warming process and to decrease the GHG emission by changing the human activities in order to avoid of the climate change on the earth.
The study analyse is based on the international scientific resources including some main opinions of experts and the international data bases including the EUROSTAT, which can make possibility to overview main trends of the EU member states from 2006 to 2014 in fields of the economic growth, energy intensity, resource-productivity and also gas emission. Széles Zs.-Zéman Z. – Zsarnóczai S. (2014, p. 323-331) authors emphasize that also the main aims for creating municipal companies are to manage the green policy of the towns and to operate the infrastructure. Therefore the decreasing rate for the creating municipal waste by waste operation is very considerable aim for the EU and the Hungarian environmental political strategy (see Table1 and Table-2).
Material and Method
The case study focuses on the environmental economic issues in the EU-28 based on the data bases concerning the different variances from the SPSS system, as Unemp0615 (Unemployment in % of active population in total), GDPaverage (GDP and main components – volumes, Million euro, chain-linked volumes, reference year 2005= 100, at 2005 exchange rates, GDP at market price, Annual average GDP growth 2005-2013), EmisNitrogen (Emissions of nitrogen oxides (NOx) by source sector, 2006-2015, Tonnes, Total sectors of emissions for the national territory), EmisSulphur (Emissions of sulphur oxides (SOx) by source sector, Tonnes, Total sectors of emissions for the national territory), EnIntAverage (Energy intensity of the economy, average of 2006-2014, kg of oil equivalent per 1 000 EUR), ResoProducti (Resource productivity, Euro per kilogram, chain linked volumes (2010), GHGEmis90 (Greenhouse gas emissions (in CO2 equivalent) indexed to 1990 = 100), ReNeFrWate (Renewable freshwater resources, Million cubic metres), GenWasteTo (Generation of waste by economic activity, Tonnes, All NACE activities plus households, 2004-2014) and also MunWaGenC (Municipal waste by waste operations, Waste generated, per capita in kg, 2005-2014).
The statistical analyses are set up the SPSS (Special Program for Social Sciences), which scientific methods were worked by Sajtos – Mitev (2007). Based on this research method the analyses need for describing the results by Factor Analysis, Descriptive Statistics, Regression Method, Graphs and Hierarchical Cluster Analysis with setting Dendrogram based on the Ward’s Method. Naturally all of the researching methods can make possibility to compare the EU-28 based on the different economic conditions with variances used in the research process. Also the data bases of Eurostat provide possibility to determine and describe measure of the environmental damages resulted by the performance of the EU member states. The variances used in this research concern such statistical data, which the OECD and EU demand for the EU member states to determine environmental damages resulted by the each EU member state and to compare the different levels and measures of the amount of the damages among EU member states.
At recent decades even after the economic crisis in 2008 the role of the state increased to avoid of decreasing the negative effects of the world economy on the national economies in spite that the EU-28 can be strong. But the EU institutional background cannot provide enough defence itself for each EU member state against influences of the world economic crisis. Therefore the environmental policy and strategy of EU member states should increase to concentrate the national economic resources to decrease the negative effects of the human activities on the nature. The policy handling crisis and the increasing role of state in the national economy can be seen in detailed in Lentner, (2010, p. 122) and Lentner-Farkas, (2004, p. 8) based on the unorthodox policy strengthening at present.
Results and Discussions
Some experts focused on that because of the role of fossil energy use decreased therefore the importance of the crude oil exporting countries will soon decrease, but this crude oil export dependence will increase during the next two years. The worst economic conditions resulted by increasing dependence on the world economic changes are critical for Yemen, Iraq, Nigeria and Venezuela. The other countries have little better conditions, for example Russia, Algeria and Kazakhstan, which are at middle level among economies with the worst and the stabile economic conditions (Sebestyénné, Szép, 2016). Mika (2016) declared that the GHG emission should decrease by 60-80%, because if the temperature increases by 3oC, the global warming effects cannot be turned back, therefore the temperature should be kept within 2oC increase in order to avoid of the more negative influences of the global warming.
Also other authors emphasized the importance of the well operating and operative bank system and bank controlling, namely: “So the strategic controlling activity regarding the bank as a whole deals with only developmental, structural and security issues; mostly with the balance sheet structure risks, market risks, structural yield options, and growth potentials.” (Kalmár et al, 2015, pp. 110-125). Also according to the innovative development, this needs to extend the knowledge of human resources, even for environment friendly technology to be introduced, as Staniewski declared that “The area of human resource management is one of the basic elements of an effectively managed company. In the era of the knowledge-based economy, its impor-tance becomes strategic as the effectiveness of activity within this scope largely determines the achievement of the company’s competitive advantage. Knowledge-based resources can be particularly important to en-sure this advantage” (Staniewski, 2011; also in detailed in J. Szopiński & T. Szopiński, 2013).
Also additionally to the decreasing tax, the productivity is important in development of the economy. As Palánkai (2006, p. 314) declared that ”The rapid growth of productivity is still of key importance, and much difference is made by how fast and successfully these countries can enter the knowledge-based society. An encouraging sign is that transnational companies in Central and Eastern Europe have made increasing investments in the R and D sector.”
The biggest investment gap from selected sectors is in fields of water management, sanitation, the food security, agriculture and education (see in Table-1). Mostly these sectors have the same investment gap, which does not show their real importance and priority in the world economy. Financial strategy and management at national level should be extended similarly to the firm –level, in which there is a role of governance, organizing, planning and controlling according to well-defined goal criteria; preparation and realization of raising capital owners. Also when companies need for financial resources, even for investment relevant to the reducing gas emission, in any case the financial institutes should follow the financial conditions and risk management of the firms or small-medium enterprises, for example analyse all business cycles, evaluate the risks and determine risk sensitivity of company (see detailed in Hegedűs-Zéman, 2016, p. 1038 and Kalmár et al, 2015, p. 111.).
The other sensitivity question is the profitability and liquidity of typical bank and firm risk factors based on the possible security policy aspects, when firms decide to implement environment friendly investments and renewable energy use. Final solution will be realised by decisions of firms and banks in the private sector of mostly developed countries. Also the different kinds of taxes as revenues of the governmental budget can make influences on the governmental balance, which can continuously have negative balance, therefore this can accumulate the governmental debt of the EU member states from year to year (Lentner, 2010, p. 125).
The governmental debt can result the devaluation of the national currencies or the common currency of the EU, namely Euro. Therefore the main aim of any country is to strengthen its economy and performance to avoid of the economic fall, the economic and financial crisis, as Domokos declared “The debt rule has been placed at the heart of legislation on public finances. Fulfilling the debt rule depends not only on reducing public debt but also on increasing the gross domestic product (GDP), as a precondition of which the principle of a competition-based economy has also been strengthened at the constitutional level” (Domokos, 2016).
From point of view of the natural resources there is a lot of water resources in Egypt, as Neszmélyi (2014, p. 62) wrote that Egypt has natural resources as energy and for agriculture and huge amount of human resources, for example renewable energy resources on the Nile river in MENA and ASEAN countries and human resources in China, Japan, and South –Korea (Kozár – Neszmélyi 2014, pp. 94-95; Neszmélyi 2014, pp. 23-24). Based on the sustainable development the natural resources should be managed, like water management, sanitation and clean development mechanization (CDM) for sustainable human health.
Table-1: Summarised data-base for the environmental economics in EU in % between 2006-2015 based on the SPSS analyse
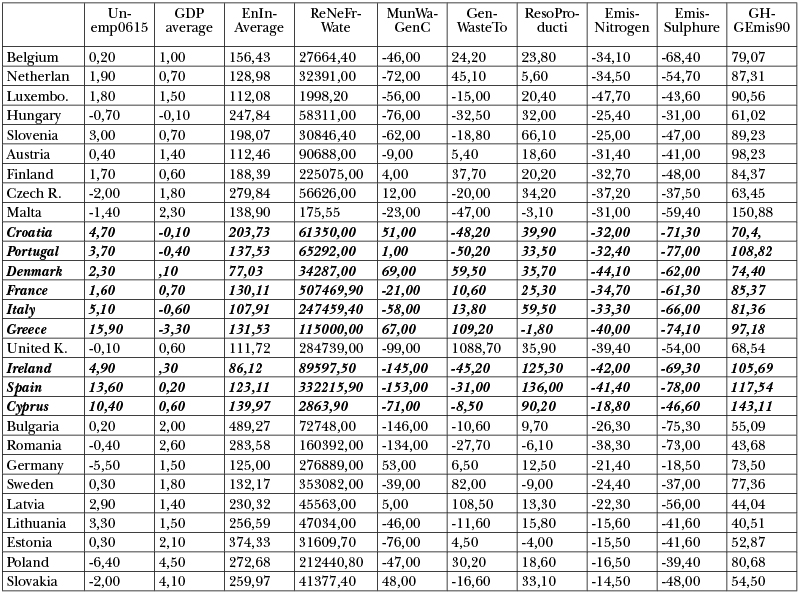
Source: Owned calculation based on the SPSS with data of Eurostat
Component-1:
Unemp0615 (Unemployment in % of active population in total), EUROSTAT, 2016
GDPaverage (GDP and main components – volumes, Million euro, chain-linked volume, GDP at market price, Annual average GDP growth, in %, 2006-2013)
EmisNitrogen (Emissions of nitrogen oxides (NOx) by source sector, 2006-2015, Tonnes, Total sectors of emissions for the national territory)
EmisSulphur (Emissions of sulphur oxides (SOx) by source sector, Tonnes, Total sectors of emissions for the national territory)
Component-2:
EnIntAverage (Energy intensity of the economy, average of 2006-2014, kg of oil equivalent per 1000 EUR),
ResoProducti (Resource productivity, Euro per kilogram, chain linked volumes (2010),
GHGEmis90 (Greenhouse gas emissions (in CO2 equivalent) indexed to 1990 = 100)
Component-3:
ReNeFrWate (Renewable freshwater resources, Million cubic metres, average between 2006-2014), EUROSTAT, 2016
GenWasteTo (Generation of waste by economic activity, Tonnes, All NACE activities plus households, 2004-2014)
Component-4:
MunWaGenC (Municipal waste by waste operations, Waste generated, Kilograms per capita, 2005-2014)
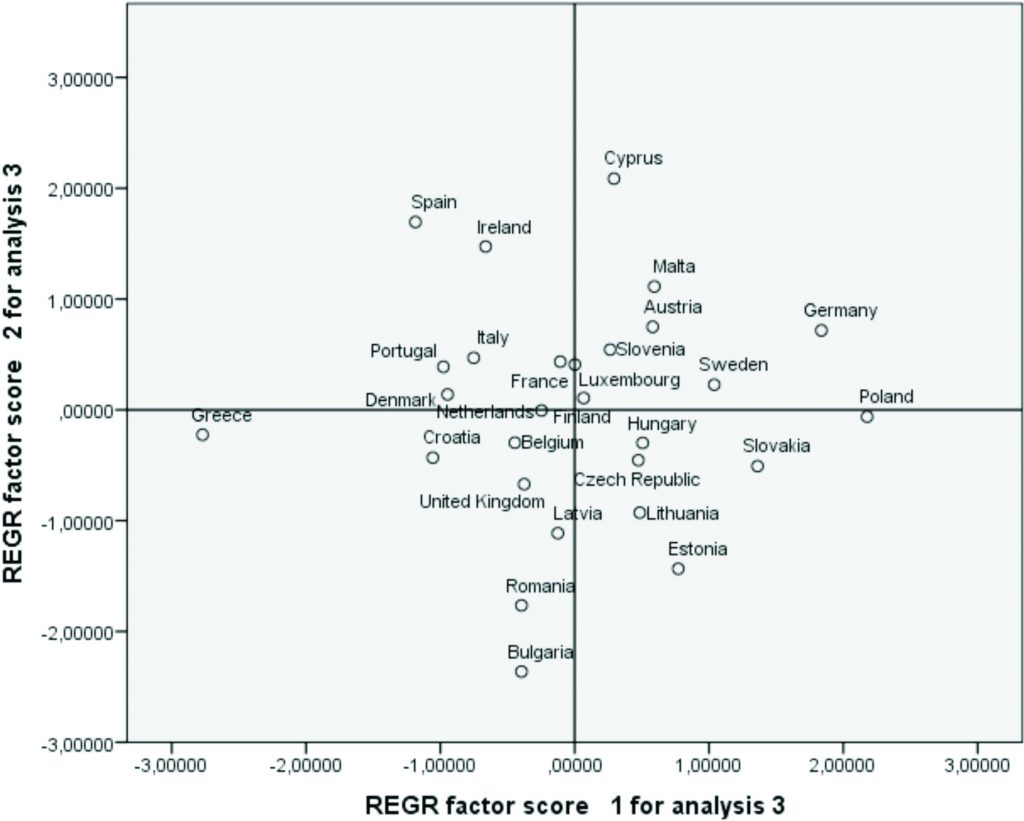
Figure-1: REGR factor score 1 and REGR factor score 2 analysis
Source: Owned calculation based on the SPSS with data of Eurostat
Component-1: Unemp0615, GDPaverage, EmisNitrogen, EmisSulphur
Component-2: EnIntAverage, ResoProducti, GHGEmis90
The statistical data based on the SPSS show that the correlations among ten variances are very strong by 93,3% and also the significance is very strong among themselves. The Total Variance Explained by the Initial Eigenvalues in Cumulative by 74,074%, which means that the first four components explain the correlations among variances by 74,074%. The Table-2, namely Rotated Component Matrix shows four components, and each component including different number of variances (see in detailed in each component including variances in Note of the Table-2).
Table-2: Rotated Component Matrixa
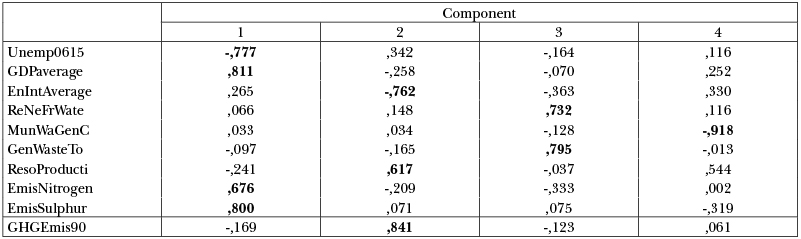
Extraction Method: Principal Component Analysis. Rotation Method: Varimax with Kaiser Normalization.
a. Rotation converged in 5 iterations. Source: Owned calculation based on the SPSS with data of Eurostat
Generally in those EU member states, which are at Principle line “X” to right side from Principle line “Y”, as from zero of score in cases of variances of the Component-1, the variance Unemp0615 has decreasing trend, and the GDPaverage, EmisNitrogen and EmisSulphur have increasing growing trends. Generally in those EU member states, which are at Principle line “X” to left side from Principle line “Y”, from zero of score in cases of variances of the Component-1, the variance Unemp0615 has increasing growing trend, and the GDPaverage, EmisNitrogen and EmisSulphur have decreasing trends.
At the principle Line “X” to the right side from the line “Y”, for the Component-1, the Unemp0615 (EUROSTAT, 2016, see Table-1 and Figure-1), has decreased, mostly by 6,4% in Poland, by 5,5% in Germany and by 2,0% in Slovakia and Czech Republic for the period of 2006-2015, at list for one decade. The other variance of the Component-1 is the GDPaverage, which has been very considerable increasing by 4,5% in Poland, by 1,5% in Germany and by 4,1% in Slovakia to Line “X” to right side.
The worst GDP decrease has been by 3,3% with increasing unemployment rate by 15,9% in Greece and by 0,6% in Italy since 2006, also some highly developed EU member states had less GDP growth by 0,7% in France, by 0,6% in UK and by 0,2% in Spain. In spite that the EU member states have had average annual GDP growth by 1% since 2006, mostly the EU member states in Middle and East European region and some other small member states had such GDP growth rate, which ensured the 1% of EU average GDP growth, for example by 2% in Bulgaria, by 1,8% in Czech Republic, by 2,1% in Estonia, by 2,6% in Romania from 2006 and by 2% in Hungary from 2010. The other variance of the Componant-1 is the EmisNitrogen, where the EU average has had decreasing rate by 30% in tonnes since 2006 until 2015. Also the EmisSulphur has averagely decreased by 54% in tonnes in EU since 2006, which can be considerable positive result from side of EU.
The variances as EnIntAverage, ResoProducti and GHGEmis90 are included in the Component-2 (see Table-4). Generally those EU member states are above the principle line “X” their variance as EnIntAverage is decreasing, and their ResoProducti and GHGEmis90 are increasing. Generally in those EU member states, which are under the principle line “X”, their variance as EnIntAverage is increasing, and their ResoProducti and GHGEmis90 variances are decreasing.
In case of the EnIntAverage those EU member states have favourable conditions, where less increasing energy use in % based on kg of oil equivalent per 1000 Euro is used for the production or services for period of 2006-2014. These states are above the principle line “X”, therefore they are not energy intensive countries. But those EU members states, which use more energy in kg per 1000 Euro and their increasing rate is considerable in this field, these are under the “X” line, therefore these member states are energy intensive economies.
For example above line “X”, 77,04% lower increasing rate for energy use was in Denmark, 125% lower increasing for energy use in Germany, 123,1% increasing rate in Spain, 130,1% in France, 112,46% in Austria and 132,2% in Sweden. These EU member states use less energy and their increasing energy use is at low level, therefore they are not energy intensive countries comparably to EU member states.
These member states are energy intensive countries, because their energy use has more increased since 2006. Some highly developed EU member states, as UK and Belgium, are also under this line “X”, in spite that they have efficient energy use, by only 111,72% increasing rate in UK and by 156,43% in Belgium, but they are under line ”X”, because their either Unemployment rate or GDP average rate variances are considerable during this period (see Table-1 and Figure-1).
In case of the ResoProducti growing rate is increasing in the resource productivity per kg in those EU member states, which are above line “X”. For example Spain has reached the most increasing rate by 136% and Ireland has reached increasing rate by 125,3% for the resource productivity since 2010, therefore the resource productivity became favourable. Also Cyprus by 90,2%, Slovenia by 66,1% and Italy by 59,5% reached increasing rate in the resource productivity. Some other EU member states reached less increasing rate for the resource productivity in Euro per kg, but their developed level could be higher than the other EU member states ‘one and also the other variances contributed that these EU member states are above line “X”, for example Germany by only 12,5%, Austria by 18,6%, Belgium by 23,8%, France by 25,3% in field of resource productivity from 2010, therefore their resource productivity became better than countries over Line “X”.
The EU member states under line ”X” have generally decreasing ResoProducti variance. For example decreasing rate of the resource productivity in Euro per kg decreased by 6,1% in Romania, then by 4,0% in Estonia and by 1,8% in Greece. Somehow increasing rate was by 9,7% in Bulgaria, by 13,3% in Latvia and by 15,8% in Lithuania in resource productivity in Euro per kg. In spite that UK has considerable increasing rate for the resource productivity by 35,9%, it has less GDP growth and the largest general waste production increase in EU, therefore UK remains under line “X”.
In general it can be declared that the resource productivity per kg has increased in EU since 2010, in spite that there are some EU member states have some backwardness in this field, for example Romania, Greece, Bulgaria, Estonia, Malta and Sweden based on the statistical data basis, they could decrease resource productivity. From the average level of the EU, as 31,5% based on the data of Table-1, there some EU member state , which have strong increasing trend in the field of resource productivity in % in Euro per kg, as Spain, Ireland, Cyprus, Slovenia, Italy, Croatia, Czech Republic, Denmark, UK, Portugal, Hungary and Slovakia. Also Germany and Belgium are strong economies, therefore their resource productivity cannot easier be developed from the highly developed level by considerable increasing rate.
The average increasing rate of EU-28 has been 81,4% in field of GHGEmis90 since 1990, which means a considerable increase in spite that EU accepted the Kyoto agreement to decrease the gas emission. Most of the developed EU member states have realised more gas emission than average level of the EU in gas emission since 1990, and also those EU member states, which do not have modern advanced environment friendly technological production in industry. For example Green House Gas emission was 150,88, as the highest level in Malta, 143,1 in Cyprus, 117,54 in Spain, 108,82 in Portugal, 105,69 in Ireland, 98,23 in Austria, 97,18 in Greece, 90,56% in Luxembourg, 89,23 in Slovenia and 87,31 in Netherlands. About half of the EU member states above line “X” have more GHG emission than the average level of the EU. Poland by 80,68 has had mostly the same GHG emission of the EU average level, as 81,4 with considerable industrial development based on the increasing Foreign Direct Investment (FDI) since 1990.
The most of EU member states are standing far from the positive economic developing trend of Germany and also they are far from the realising implementation of this economic developing trend in case of Germany, which can lead to the economic social results requested by the EU strategy. The support system should be realised by supporting Small and Medium scale Enterprises (SMEs) with developing environment friend technology to avoid of the global warming and climate change.
In the Figure-2 in those EU member states, which are above the line “X” the ReNeFrWate is generally higher in average amount of renewable freshwater resources in million cubic meter than in EU member states under the line “X”. The line “X” can be equally with the average renewable freshwater resources of the EU, which is 125000 million cubic meters averagely between 2006 and 2014. France has the largest renewable freshwater resources by 507469,9 million m3, after that 353082,0 million m3 in Sweden, 332215,9 million m3 in Spain, 284739,0 in UK, 276889,0 in Germany, 247459,4 in Italy and 225075,0 million m3 in Finland. Naturally EU member states with less area cannot have more renewable freshwater resources. Also the drought weather can make influences on decreasing the amount of the freshwater resources in each member state. In spite that there are some EU member states have less amount of freshwater resources, but altogether these freshwater resources can be seen as considerable in EU. Also UK has more freshwater resources than France comparably to the area-size of UK. France has double more lands than the UK has one.
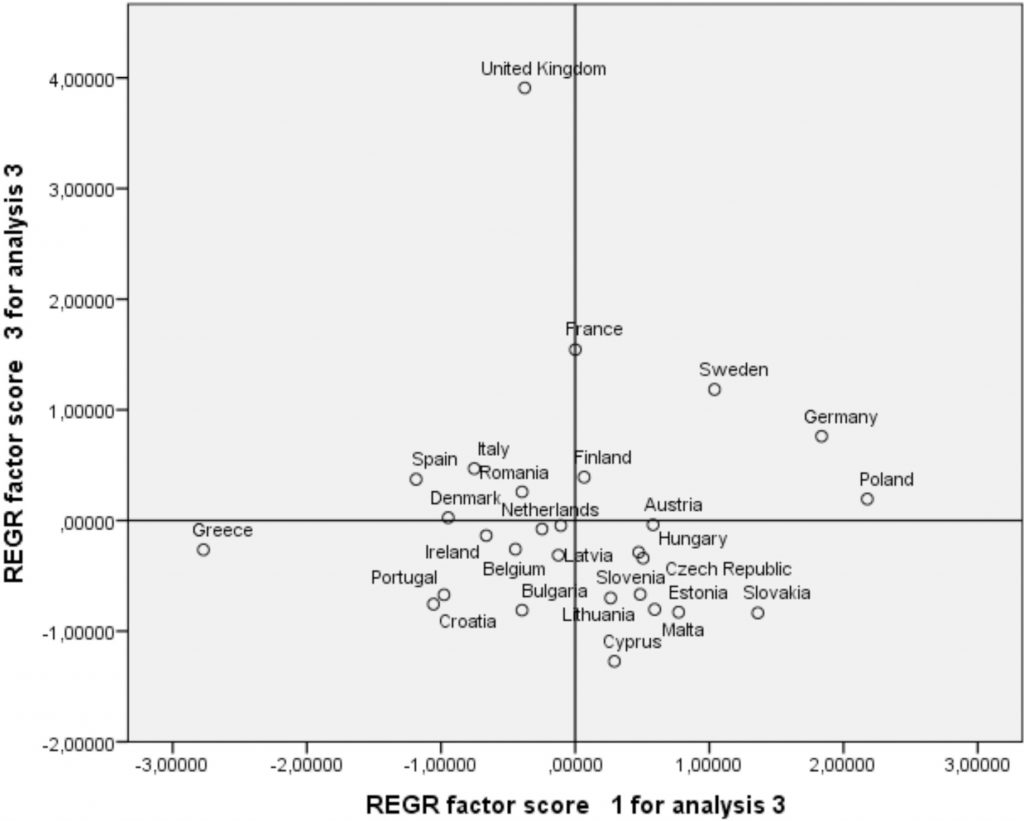
Figure-2: REGR factor score 1 and REGR factor score 3 analysis
Source: Owned calculation based on the SPSS with data of Eurostat
Component-1: Unemp0615, GDPaverage, EmisNitrogen, EmisSulphur
Component-3: ReNeFrWate, GenWasteTo
Within the soil degradation, the soil erosion is a very important difficulty, which is resulted by water and also the wind. Naturally the erosion is influenced by climate change, as global warming, and land use, also some conservation practices at the surface of soil. The soil loss resulted by erosions can be calculated as more than 1 ton per hectare annually, which has occurred for the last between 50 and 100 years. The water erosion makes influences on 115 million hectare soil areas, which can be equally with about 12% of total land area in Europe, while the wind erosion affects concerned 42 million hectare soil areas (EEA, 2009).
In case of the GenWasteTo the EU member states above line “X” have considerable increasing rate for the generation of waste. The biggest EU member state producer has been the UK by increasing rate 1088,7% per capita in kg since 2004. Also some EU member states have increased the generation of waste, for example Greece by 109,2%, Latvia by 108,5%, Sweden by 82,0%, Denmark by 59,5% and Netherland by 45,1% for 2004-2014. Some other EU states have less increasing rate in this one, like Germany, France, Italy and Austria. Also 14 EU member states have decreased the generation of waste since 2004. Hungary has realised positive result by decreasing 32,5% since 2004. The EU member states have strong increasing rate in production of generation of waste, which have considerable heavy industry or animal husbandry producing waste as by-product. Some of these member states started to use new technology based on the re-cycling waste in order to avoid of the heavy concentration of the generation of waste. The Figure-2 well shows how much UK achieved the worst and the biggest result in producing the generation of waste in all EU not using the re-cycling process to decrease this large amount of the generation of waste.
Based on the Figure-3, MunWaGenC variance shows considerable decreasing rate per capita in kg, from 2005 to 2014 in cases of the EU member states above line “X”, for example Spain has reached the biggest decreasing rate by 153,0% since 2005, Bulgaria by 146,0, Ireland by 145,0% and Romania by 134,0% above the line “X”, while the EU average level in the municipal waste was not so considerable decreasing rate by 38% from 2005 till 2014. Some other EU member states produced municipal waste by considerable increasing rate, for example Germany by 53,0%, Denmark by 69%, Greece by 67,0%, Croatia by 51,0% and Slovakia by 48,0% under the line “X”. Some other EU member states produced municipal waste by considerable increasing rate, for example Germany by 53,0%, Denmark by 69%, Greece by 67,0%, Croatia by 51,0% and Slovakia by 48,0% under the line “X”.
In 1995 the municipal waste land-filled was 100%, therefore comparably to results of 1995 in Slovakia these were little higher, in Czech Republic this was about 70% in 2008. In Italy the municipal waste land-filled was about 62% in 2003 and 50% in 2008 comparably to 100% of 1995. Most favourable results of Austria in Alps–Adrian region was 30% in 2003 and about 3% in 2008. By the end of 2008 in Switzerland, Germany and The Netherlands the municipal waste land filled was about 1% or less in 2008 comparably to 100% of 1995 (EEA 2007a; EEA 2007b). This trend can be understood if we know that land-filled was about 40% of all municipal waste, not at level of household economies in EU-27 by the end of 2008. Based on the resource use per person in EU between 2000 and 2007 the domestic material consumption (DMC) increased by little measure about 2% in EU-12, as new member states, over up the DMC average level of EU-27 by the end of 2007. The DMC is an aggregate of materials – excluding water and air -, which are actually consumed by a national economy (SERI, 2009). Additionally to use of DMC the water use becomes very considerable, even when the available water resources are very scarcity at present and also in the future the scarcity water will be much less under level, which is excepted by the minimum use for survive of the people life. Finally by the beginning of 2010s in the EU there were about between 118 and 138 million tonnes of bio-waste produced annually, of which approximately 88 million tonnes was municipal waste (EC, 2010). This shows that annually the considerable amount of waste are produced in EU and also the share of the waste produced by family holds is considerable in spite that its portion less than the waste production of municipal organizations.
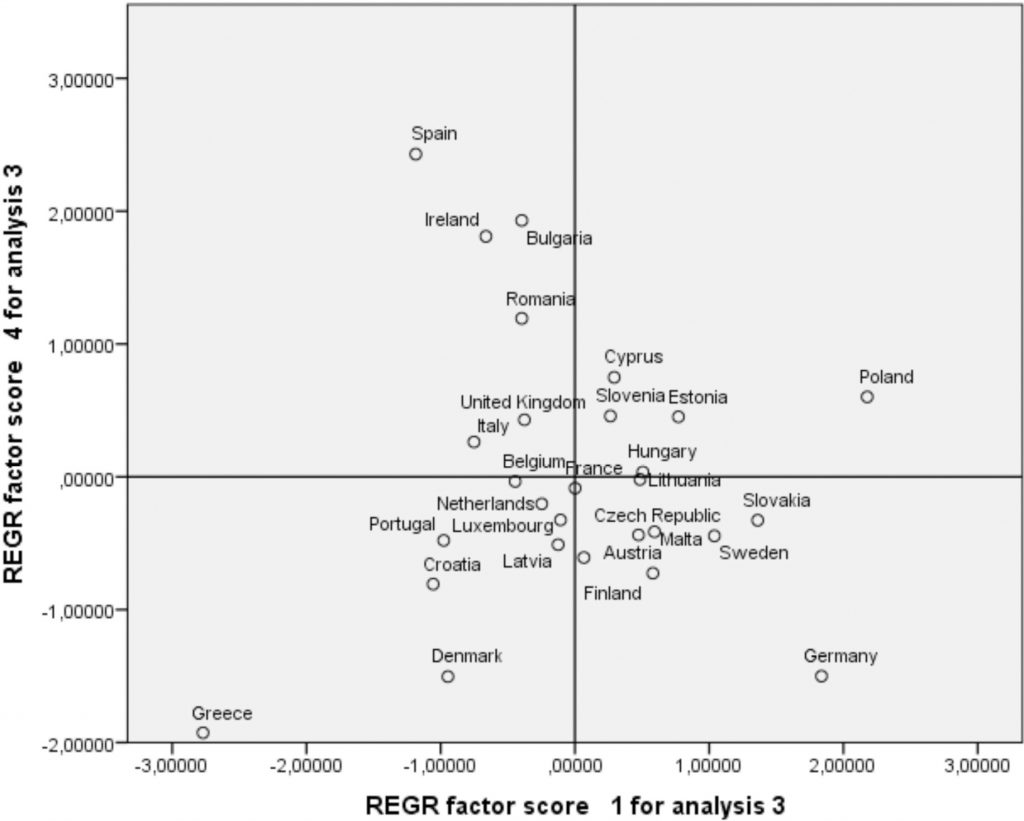
Figure-3: REGR factor score 1 and REGR factor score 4 analysis
Source: Owned calculation based on the SPSS with data of Eurostat
Component-1: Unemp0615, GDPaverage, EmisNitrogen, EmisSulphur
Component-4: MunWaGenC
Some conclusions for environmental conditions in Hungary
Hungary has decreasing unemployment rate by 0,7%, which is considerable in the EU-28, because of the most of them have large or larger unemployment rate, and these countries are at lefts side of the principle line of “X”. The GDPaverage has been less decline, in Hungary by 0,1% because since 2006, because the governmental financial debt has been considerable until 2010, and only since the beginning of 2010s the economic growth has started its prosperity by stimulating the national companies and international corporations to increase their investments and Foreign Direct Investments in Hungary. The GDP growth of Hungary has increased rate by 2% since 2010.
Hungary reached less decreasing gas emission by 31% in Sulphur and by 25,4% in Nitrogen than average level of the EU as by decreasing rate 54% in Sulphur and by 30% in Nitrogen since 2006. Other part of the EU member states under the line “X”, for example Bulgaria, where 489,27% increasing energy use in % based on kg energy has been used for 1000 Euro valued production or services averagely for the period of 2006 – 2014, also 374,3% increasing rate in Estonia, 283,6% in Romania and 247,84% in Hungary, which last one is at middle level concerning the average of EU, as 187% increasing energy use.
Hungary has 32% increasing rate for the resource productivity, which can be mentioned as good, because it is closed to the average level of EU, as 31,5% increasing rate since 2010. Hungary could have decreased the gas emission by 61,0% since 1990 less than average GHG gas emission of EU with selling some parts of the national GHG emission quote. Hungary has favourable natural conditions for creating good adequate amount of renewable freshwater resources concerning the area-size of the country, which is 58311,0 million m3 averagely between 2006 and 2014. The water management is important from multi-side reasons, either renewable freshwater resources or renewable energy resources, also to avoid of the negative influences of the water erosion for soil degradation (see Table-1 and Figure-2).
In Hungary 1 mm deep soil loss resulted by erosion is 14 t per hectare. The erosion is various depending on deep loss in mm based on the amount of ton per hectare, which are as follows: 1. Strong erosion is 112 ton per hectare in case of 8 mm in deep loss. 2. Middle erosion is 70 ton per hectare in case of 5 mm in deep loss. 3. Moderately erosion is 42 ton per hectare in case of 3 mm in deep loss. Since the end of 1960s the soil loss resulted by erosion has been about 50 million m3 annually in Hungary (Thyll, 1996). Hungary has well fertile flat land and about 44% of its soil has unfavourable hydro–physical properties, and about 2.3 million ha area are affected by water erosion and 1,3 million ha by wind erosion. About 2.3 million ha of acidic soil and around 10% of Hungary is affected by salinization. The poorest quality of soil is found in the sandy areas, the main depressions of the Great Hungarian Plain and hilly areas. Also the best soil conditions are found in the Aeolian soil plateaux of Transdanubia (Várallyay, 2007).
The other difficulty is the salinization of soil, which connects with human activities, when the people use either unfavourable irrigation system or in some areas of Europe highly level of salt content water, is used. The salinization process can be considered almost on 3.8 million ha areas of Europe. Also the soil contaminations included heavy metal and mineral oil widely extended in 3 million sites of Europe (EEA 2007a; EEA 2007b; EEA 2009). Hungary could have realised considerable decreasing rate by 76,0% in municipal waste by two times more than the EU decreasing average level since 2005. In 1995 the municipal waste land-filled was 100%, therefore comparably to results of 1995, in Hungary the municipal waste land-filled was about 85% in 2003 and 75% in 2008.
Hungary is in the first group, where member states could reach little unemployment increase with increasing GDP growth, mostly as the EU average, while the second group including Germany and Sweden realised less unemployment rate with favourable level of the GDP growth in EU-28. The GDP increasing growth of the EU-28 could be realised mostly by the Central-East European EU member states, because without their GDP growth, the EU has not provided 1% of GDP growth for the period of 2006.-2014. The less increasing rate of energy-intensity of the economy was the best in UK, as the 5. Country group and 4. Country-group, but this last one has less energy intensity industry, and these member states do not have strong industry. The first group, Hungary has a higher level of energy-intensive, than the average level of the EU in this field for the energy use. Also the first country group mostly realised the EU average level in field of the gas emission, municipal waste and resource productivity, while this group considerably decreased generation of waste, more than the EU. Because of the first group including Hungary has less renewable freshwater resource, than the average measure of the EU-28, therefore also Hungary should focus on the more efficient water management and create water reserves to keep back the water running from Hungary.
The main economic difficulty is for the EU, that the unemployment rate increased by 2,1%, while the GDP average growth rate was just only by 1% – one percent -, which can be titled as unfavourable economic growing conditions. Only the EU member states in Central and East Europe included Hungary provided the average GDP growth for all of the EU. The EU should more stimulate the FDI and EU transnational corporations to increase the jobs to decrease unemployment and to avoid of the political and social crisis. Also the innovative technology should follow the strategic aims of environmental conservation policy to mitigate the gas emission. Hungary successfully forced to stimulate the transnational corporations to increase their investments and to extend the advanced environment-friendly technology based on the Foreign Direct Investment (FDI) inflow into Hungary.
At present in EU the unemployment rate presses the demographic conditions in direction to the negative trend, because the unemployment problem mostly concerns the youth people, in case of which the unemployment rate increases more, which does not stimulate the youth people to create families with new generation. This resulted the decreasing rate of population in all EU. In Hungary the employment level has considerably increased for the last two years and also the salary and pension could have increased mostly since the beginning of the 2016, which can also continue in 2017. The increasing growth of employment in Hungary accompanying with strengthening the social network can stimulate to increase the population and number of births.
The EU has a considerable problem concerning the Generation of waste by economic activity from point of view of the environmental conservation strategy. The EU should considerably decrease either Generation of waste and Municipal waste accompanying with decreasing GHG emission. The Hungarian authorities have helped the inhabitants to realise the selective waste collection for the last four-five years in order to avoid of increasing the generation of waste. This Hungarian governmental efforts stimulated the companies working in Hungary to decrease waste.
The Water management, renewable freshwater resource issues should be developed in the EU, because this water management is very costly with very considerable waste and pollution around water resources. In Hungary the biggest water cleaning equipment – investment in Central Europe was realised in South Budapest at beginning of 2010s by support of the EU. This investment is aimed at remaining clean water of Danube.
Also the water renewable energy use is to be developed to direction of bigger share of all energy use. EU is dependent on the fossil energy from Russia and Middle East OPEC countries, therefore the water renewable energy use can be more favourable for the EU. Energy intensive has increased since middle of 2000s and therefore the energy use is not productivity. This situation increases the one-side energy dependence for EU and opposite to the original energy strategy from Rome Treaty in 1956. The main difficulty is in EU, that the Energy intensity considerably increased, namely 186,98%, more than the Resource productivity, namely by 31,47% in EU for the last decade (see Table-6). Therefore also the Resource productivity should be developed in EU in order to obtain and increase more competitive position for EU on the World economy.
Sándor J. Zsarnóczai
Szent István University, Faculty of Economic and Social Sciences, Institute of Regional Economics and Rural Development, 2100 Gödöllô, Páter Károly u.1, HUNGARY, e-mail: zsarnoczai.sandor@gtk.szie.hu
Ottó Bence
Universität Tübingen, PhD Students
References
Domokos L. (2016b): Culmination of the Powers of the State Audit Office of Hungary within the Scope of New Legislation on Public Funds. Journal of Public Finance Quarterly, 2016/3 291
EC (European Communities, 2010): Communication from the Commission to the Council and the European Parliament on future steps in bio-waste management in the European Union. Brussels, 18.5.2010. COM(2010)235 final.
EEA (European Environment Agency, 2007a): Europe’s Environment – the fourth assessment. Belgrade Report, EEA, Copenhagen
EEA (European Environment Agency, 2007b): The pan-European environment: glimpses into an uncertain future. EEA Report No. 4/2007,EEA, Copenhagen, and NAMEA: National Accounting Matrix including Environmental Accounts): Austria, Czech Republic, Denmark, Germany, France, Italy, Netherlands, Portugal and Sweden.
EEA: 2009. Water resources across Europe – confronting water scarce and drought. EEA, Copenhagen
EUROSTAT, 2016
Hegedűs Sz- Zéman Z (2016): Prevalence of capital structure theories among municipal companies) Statisztikai Szemle, Vol. 94. No. 10, 2016, pp. 1032-1049.
Kalmár P. – Zéman Z. – Lukács J. (2015): Bank controlling with a marketing attitude – applied statics in the service of controlling. Financial and Economic Rewiew 14:(4) pp. 110-125.
Kozár L. – Neszmélyi Gy. I. (2014): Water Crisis in the Nile-Basin -: Is It Really a Zero Sum Game? Journal of American Business Review, Cambridge 2: (2) pp. 91-98.
Lentner Cs. – Farkas R (2004): Kritische Punkte der Wirtschaftsentwicklung in Ungarn ZEITSCHRIFT FUR GEMEINWIRTSCHAFT: ZGW 39:(6) pp. 7-18.
Lentner Csaba (2010): The Macro-Economical Environment of Public Accountancy and Financial Regulation ECONOMY AND SOCIETY 1-2: pp. 121-132.
Mika, J. (2016). Stop the climate change: Issue, p. 49. Eger, Lecture-Manuscript, (In Hungarian: A klímaváltozás megfékezése: feladat, ígéretek és realitás Párizs után)
Neszmélyi Gy. I. (2014): Disputes and opportunities about the sustainable and mutually beneficial utilization of Nile River. In: Neszmélyi Gy. I (edited) Socio-Economic and regional processes in the developing countries, Szent István University Publishing, Gödöllô, ISBN 978-963-269-461-0, 23-38
Palánkai T. (2006): Theoretical relevances of our integration maturity. Journal of Public Finance Quarterly. Volume 51, 3 issue.
Sajtos L – Mitev A. (2007): SPSS kutatási és adatelemzési kézikönyv. Alenia Kiadó, Budapest
Sebestyénné, Szép, T. (2016). Energy economics or periphery of the economics, Miskolc, Lecture-Manuscript p. 17 (In Hungarian: Energia gazdaságtan, avagy a közgazdaságtan perifériája)
SERI (Sustainable Europe Research Institute, 2009): Global 2000, Friends of the Earth Europe, 2009, Over-consumption? Our use of the world’s natural resources, Brussels, EU.
Staniewski, M. W. (2011). Management of Human Resources in the Aspect of Innovativeness. pp. 84-91. CONTEMPORARY ECONOMICS, Vol. 5 Issue 1 2011,
DOI: 10.5709/ce.1897-9254.7
https://scholar.google.pl/citations?view_op=view_citation&hl=pl&user=hDoMRq0AAAAJ&citation_for_view=hDoMRq0AAAAJ:KlAtU1dfN6UC
Széles Zs. – Zéman Z. – Zsarnóczai J. S. (2014): The developing trends of Hungarian agricultural loans in term of 1995 and 2012. AGRICULTURAL ECONOMICS-ZEMEDELSKA EKONOMIKA 60:(7) pp. 323-331.
Szopiński, J., & Szopiński, T. (2013). The Influence of Family Relationships on Creativity in the Workplace, „Gifted and Talented International” 2013, vol 28, nr 1-2, 185-196;
Várallyay, Gy (2007): A globális klímaváltozás: hazai hatások és válaszok. In: Láng István, Csete László és Jolánkai Márton (Edited by): A VAHAVA Jelentés. Agrokémia és Talajtan, Vol. 56 No. 1 pp 199-202
Hyperlinks:
http://ec.europa.eu/eurostat/tgm/table.do?tab=table&init=1&plugin=1&language=en&pcode=tsdec360
http://ec.europa.eu/geninfo/legal_notices_en.htmhttp://ec.europa.eu/eurostat/data/databasehttp://ec.europa.eu/eurostat/tgm/table.do?tab=table&init=1&plugin=1&language=en&pcode=ten00106
http://ec.europa.eu/geninfo/legal_notices_en.htm
http://ec.europa.eu/eurostat/tgm/table.do?tab=table&init=1&plugin
http://ec.europa.eu/eurostat/tgm/table.do?tab=table&init=1&plugin=1&language=en&pcode=tsdpc270
http://ec.europa.eu/geninfo/legal_notices_en.htm
http://ec.europa.eu/eurostat/tgm/table.do?tab=table&init=1&plugin=1&language=en&pcode=tsdpc260
http://ec.europa.eu/geninfo/legal_notices_en.htm
http://ec.europa.eu/eurostat/tgm/table.do?tab=table&init=1&plugin=1&language=en&pcode=tsdcc100

@ WCTC LTD --- ISSN 2398-9491 | Established in 2009 | Economics & Working Capital